Trying to make sense of your Instagram Insights can feel like staring at a dashboard full of blinking lights. What do all these numbers—reach, impressions, engagement—really mean? It’s easy to get lost, but here’s the secret: it’s not a report card. It’s a roadmap.
Each metric tells a piece of a story about who’s seeing your content, whether they care, and what they do next. Learning to read that story is the difference between guessing and growing.
This guide will show you how to translate those confusing numbers into actionable steps, so you can stop guessing and start seeing real results.
Stop Guessing What Your Instagram Data Means
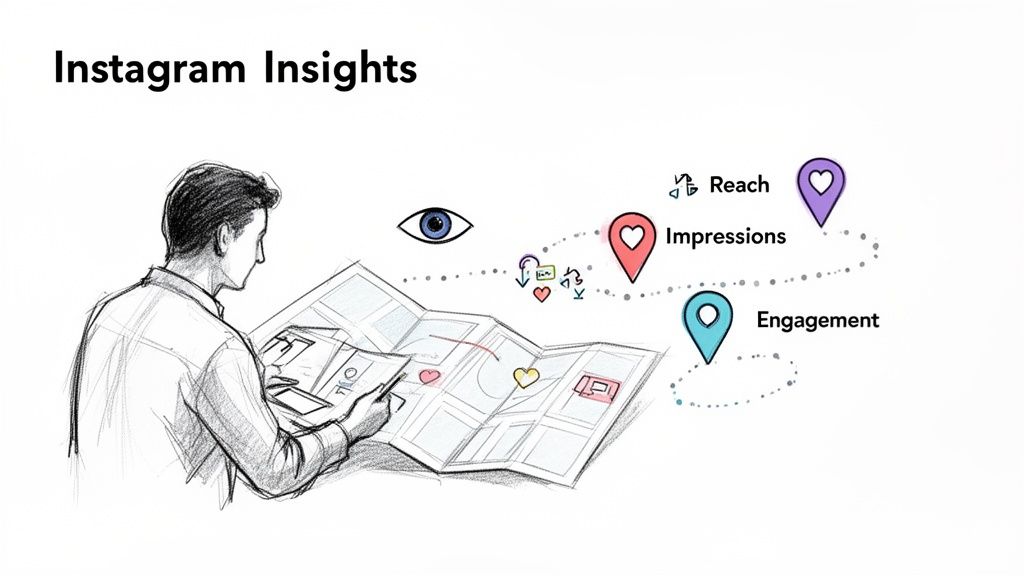
Instagram Insights
You don’t need a data science degree to understand your performance. You just need to translate the numbers into real-world answers.
For an e-commerce brand, that means turning a “save” into a future customer. For an agency, it means showing a client how “profile visits” translate into tangible brand interest. This guide will walk you through exactly that—transforming confusing analytics into a clear plan of action.
The real power of Instagram Insights isn’t just knowing your numbers; it’s understanding the story they tell so you can write the next chapter yourself.
Let’s start with a high-level cheat sheet. Think of this as your quick-glance guide to the core metrics you’ll see every day.
Quick Guide to Core Instagram Metrics
This table breaks down the most fundamental metrics in Instagram Insights. Use it as a quick reference to understand what your data is telling you at a glance.
| Metric | What It Measures | Actionable Insight |
|---|---|---|
| Reach | The number of unique accounts that saw your post. | This is your true audience size. High reach means you’re successfully finding new people. |
| Impressions | The total number of times your post was viewed. | This shows content visibility. High impressions mean your message is getting in front of people, possibly multiple times. |
| Engagement | The number of likes, comments, shares, and saves. | This is your resonance score. It measures if your content is sparking a reaction. |
| Profile Visits | The number of times your profile was viewed. | This signals deeper interest. A user took an extra step to learn more about you. |
| Website Clicks | The number of taps on the link in your bio. | This directly measures traffic. It’s how well your Instagram is driving people toward your business goals. |
Getting a handle on these five metrics gives you a solid foundation. They are the building blocks for understanding everything else your Instagram analytics have to offer.
Audience Growth Metrics: How Many People See Your Content
Instagram Insights Marketing Funnel
Before you can get a single like, comment, or sale, people have to actually see your content. It’s the first, most crucial step. Audience growth metrics show you exactly how many eyeballs your posts are getting, measuring the very top of your marketing funnel.
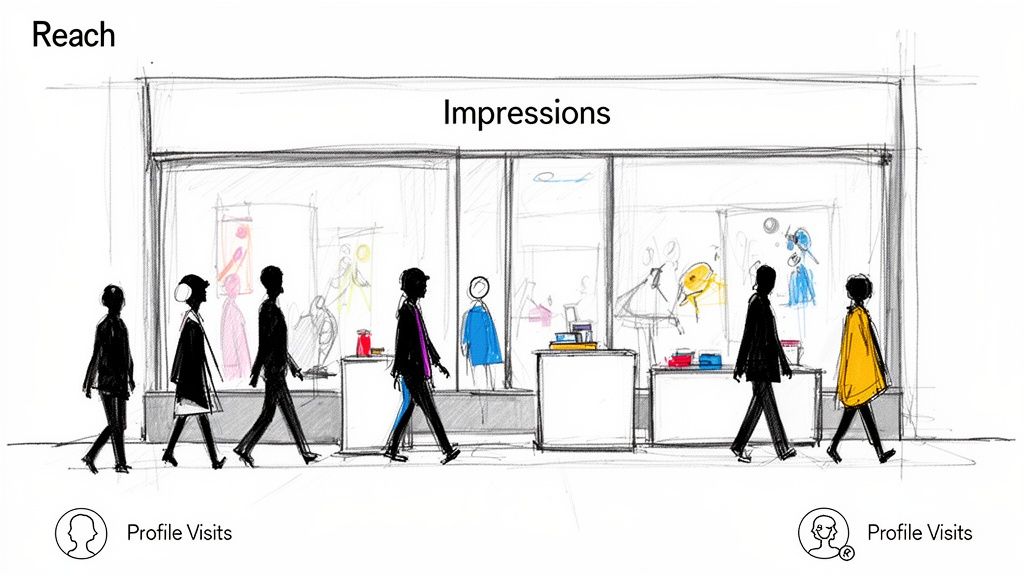
Think of it like a physical storefront. Reach is the number of unique people who walked past your shop. Impressions are the total number of times people glanced in your window—even if the same person peeked in multiple times.
Both are vital, but they tell you very different things about your performance.
Reach vs. Impressions: What They Mean for Your Business
Reach is all about the size of your audience for a specific post. Are you breaking out of your bubble and finding new people? This number shows how many unique accounts saw your content.
Impressions, however, measure frequency. If your Impressions are way higher than your Reach (say, 1,000 Reach and 5,000 Impressions), it means your followers are seeing your content over and over. This is great for drilling home a key message or promoting a limited-time offer.
A high impression-to-reach ratio shows your content is sticky. It keeps reappearing in your followers’ feeds, which is a strong signal to the algorithm that your post is hitting the mark.
Practical Use Case: An e-commerce brand launches a new product with a Reel. High reach on that Reel means it’s successfully pulling in new potential customers. If that same Reel also has high impressions, it shows their existing followers are seeing it repeatedly, building brand recall, and pushing them closer to a purchase. Nailing this balance is a core part of any strategy to grow your Instagram followers organically.
Profile Visits: The First Sign of Deeper Interest
While reach and impressions are about passive viewing, Profile Visits show active interest. This metric tracks how many people clicked from your post or story to land on your main profile page.
It’s the digital equivalent of someone walking past your store, stopping, and deciding to step inside to look around. A sudden spike in profile visits after you post is a huge win. It tells you the content was so compelling it made people stop scrolling and seek out more information.
-
For an Agency: You post a “behind-the-scenes” carousel for a client and see a 300% jump in Profile Visits. This is hard proof that your content strategy is building brand curiosity—tangible data to show the client their investment is working.
-
For a Coach: You share a quick-tip Reel that starts to go viral. By tracking Profile Visits, you see thousands of new viewers are checking out your bio, which directly leads to more clicks on your webinar sign-up link.
By digging into which content drives the most profile visits, you can stop guessing and start doubling down on what actually turns casual viewers into genuinely interested prospects.
Engagement Metrics: Is Your Content Actually Resonating?
So, your post just hit thousands of people. High-five! But here’s the real question: did they care?
While reach and impressions tell you how many eyeballs saw your content, engagement metrics tell you if it actually landed. Likes are a nice pat on the back, but they don’t pay the bills. True resonance comes from interactions that signal genuine interest—the stuff that tells you you’re on the right track.
This is where you separate vanity from value. It’s how you prove your content isn’t just being seen, but felt.
Beyond Likes: Meet “Accounts Engaged”
This is your main barometer for whether your content is hitting the mark. Accounts Engaged is a single metric that bundles together every meaningful interaction on your post. Think of it as your content’s report card.
It includes:
- Likes: The classic nod of approval. Quick and easy.
- Comments: Someone was moved enough to stop, think, and type. This is the start of a conversation.
- Shares: The ultimate compliment. Your content was so good, someone put their own reputation on it by sharing it with their friends.
- Saves: A powerful signal of intent. The user found your content so valuable they want to come back to it later.
Looking at these metrics together tells a much richer story. A post with sky-high reach but barely any engagement is a red flag. Your visuals might have stopped the scroll, but your message fell flat.
Why Saves Are Your Secret Weapon
Of all the engagement metrics, Saves are a game-changer. A like is passive. A double-tap. But a save? That’s a deliberate action. It’s someone raising their hand and saying, “This is too good to lose. I need this for later.”
For an e-commerce brand, a save on a product post is a massive buying signal. For a service provider, a save on a “how-to” Reel means you’ve just become a trusted resource.
Saves are your crystal ball for future conversions and a goldmine for your content strategy. If a post gets a ton of saves, your audience is screaming at you: make more of this!
This is especially true on a platform that’s on track to hit 3 billion monthly active users by 2026. According to recent Instagram statistics, carousels often pull in a 3.55% engagement rate relative to their reach, and with 50% of users regularly interacting with brands, each one of those saves, comments, or shares is a potential conversation starter.
Turning Engagement Into Real Action
High engagement isn’t just a feel-good number—it’s a business trigger. When a post blows up with comments, shares, and saves, you’ve struck gold. You’ve identified a hot topic and a highly interested segment of your audience.
Don’t let that momentum die.
This is the perfect moment to act. For example, using a tool like Clepher, you can automatically send a targeted DM broadcast to everyone who engaged with that specific post. You’re no longer shouting into the void; you’re whispering to people who have already told you they’re listening. Offer a related resource, a special discount, or just start a one-on-one conversation. This is how you turn passive scrollers into active customers.
Action-Oriented Metrics: What Are People Doing Next?
Instagram Tracking
While engagement metrics show you how much people love your content, action metrics tell you what they’re doing about it. This is where your Instagram activity starts making a real impact on your business goals.
Frankly, these are your “money metrics.” They represent someone deliberately taking a step down your sales funnel, turning from a passive follower into a genuine lead.
Practical Use Case: For an e-commerce brand, a Website Click from a product post is a direct line to a shopping cart. For a local restaurant, a Directions Click means a customer is literally on their way.
The Big Three Action Metrics
When you see these numbers go up, you know your content isn’t just entertaining—it’s driving tangible results.
- Website Taps: The number of times someone has clicked the link in your bio or a link sticker in your Stories. This is your main traffic driver.
- Email Clicks: This tracks how many people tapped the “Email” button on your profile, sending a direct invitation for a one-on-one business conversation.
- Call/Text Clicks: Measures taps on your “Call” or “Text” buttons. For any service-based or local business, this is a hot lead calling you directly.
Think of these clicks as hand-raises. Each one is a person saying, “I’m interested, tell me more.” And to really get the full picture, you should also analyze metrics like Instagram Saves, which show you what content people value enough to come back to later.
A high click-through rate from your profile to your website is the ultimate validation of your content strategy. It proves your Instagram presence is effectively funneling qualified leads right where you want them.
From Vague Clicks to Trackable ROI
Getting clicks is great. But knowing exactly which post drove that click? That’s a game-changer. This is where UTM parameters come in.
UTMs are small bits of code you add to your URL. They don’t change the destination, but they tell your analytics software (like Google Analytics) precisely where that visitor came from.
Example: SaaS Company Launch
Let’s say a SaaS company is announcing a new feature. They want to know which type of post drives more sign-ups: a tutorial Reel or a carousel post with customer testimonials.
- Reel Link:
yourwebsite.com/signup?utm_source=instagram&utm_medium=social&utm_campaign=new-feature&utm_content=reel-tutorial - Carousel Link:
yourwebsite.com/signup?utm_source=instagram&utm_medium=social&utm_campaign=new-feature&utm_content=carousel-testimonial
A week later, they log into their website analytics. They see the “reel-tutorial” link generated 75 sign-ups, while the “carousel-testimonial” link only brought in 20.
The meaning is crystal clear: their audience responds far better to seeing the feature in action. This insight lets them pour their resources into what works for future launches. This is how you transform vague Instagram stats into a precise, ROI-driven marketing machine.
Going Deeper: How to Read Your Story and Reel Metrics
While your overall post metrics give you a solid overview, you need a different playbook for Stories and Reels. The Instagram insights meanings here are all about attention span.
These fast-moving formats have their own unique analytics that tell you how well you’re hooking viewers and keeping them engaged. It’s not just about whether they watched; it’s about how they watched.
Reading the Tea Leaves of Your Instagram Stories
Story insights are less about a single view and more about tracking a user’s journey through your content sequence. Every tap tells you something important.
- Taps Forward: Think of this as your audience saying, “Get to the good part.” A few taps forward are normal, but a ton is a red flag. It means your content is dragging or isn’t landing.
- Taps Back: This is a golden metric. When someone taps back, they’re re-watching the previous slide. It means your content was so valuable or fast that they wanted a second look.
- Next Story (Swipes Away): This means the user swiped right past your entire Story to see the next account’s content. Your sequence didn’t hold their attention.
- Exits: This is the most brutal piece of feedback. An Exit means your slide was the reason someone left the Stories experience entirely. It’s a clear signal of a major disconnect.
A high number of Exits is a direct message from your audience: “This wasn’t it.” It’s your cue to rethink your Story content. Maybe you need to shorten your videos, add more polls and stickers, or just craft a much stronger hook. To get a better handle on these formats, check out our guide on Instagram Reels vs. Stories.
Unpacking Your Reel Performance
Reels are a different beast. The metrics here are all about consumption and replay value.
It all starts with Initial Plays vs. Replays. Initial Plays are the unique views your Reel gets. But Replays—that’s where the magic is. This number tracks how many times someone re-watched your Reel after it finished. A high replay count is pure content gold.
Practical Use Case: A DTC brand posts a 15-second Reel showing a quick “product hack.” They get 10,000 Initial Plays and 8,000 Replays. That’s a massive win. It tells them the information was so useful that people needed to watch it again to catch all the details.
The other game-changer is Average Watch Time. This metric tells you exactly how long people are sticking around. If your 30-second Reel has an average watch time of 28 seconds, you’ve created “sticky” content. But if that number is only 5 seconds, you know you’re losing people right at the start and need to seriously work on your opening hook.
Putting It All Together: Turn Insights Into Automated Action
Knowing what your Instagram Insights mean is a great first step. But data without action is just numbers. This is where you connect the dots, turning analytics into an automated system that works for you 24/7.
Start with a simple weekly review. Just set aside 30 minutes to pinpoint your top-performing content. Look for patterns. Did Reels with a certain hook get the most Saves? Did carousels explaining a product feature drive the most Website Clicks? These aren’t just stats; they’re direct instructions from your audience.
Connect Data to Automation
The real magic happens when you feed these learnings directly into your marketing automation. While platforms like saucial.app help streamline social media management, let’s walk through a specific workflow using a conversational tool.
Practical Use Case: You notice a post about your new sneaker line has unusually high engagement—tons of likes, comments, and saves. This is a massive signal of interest.
Instead of manually replying to every person, you can use a tool like Clepher to automatically tag anyone who engaged with that specific post. Then, you can send a targeted promotional broadcast via Instagram DM only to that group, offering them a special discount on the new sneakers.
This transforms a simple post into a lead-generation machine. You’re not blasting your entire audience; you’re starting a relevant conversation with people who have already raised their hand.
The diagram below breaks down how to read your Reel metrics to find these exact kinds of opportunities.
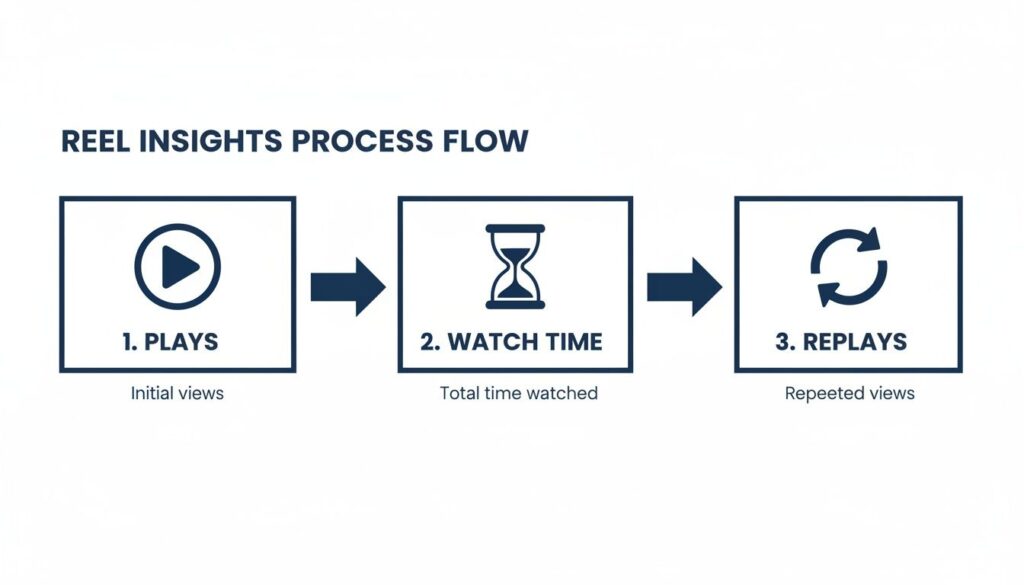
Instagram Reel Insights Process Flow
That flow from Plays to a high Watch Time and tons of Replays tells you one thing loud and clear: viewers found that content so valuable they had to watch it again.
Ultimately, this is about building a system. High Saves on a Reel about a customer problem can trigger a keyword in your automation software. When someone DMs you that keyword, it kicks off a conversational flow that offers a solution, nurturing them from a casual viewer into a qualified lead. If you want to go deeper, you can learn more about how Instagram DM automation can scale these kinds of interactions.
Your Common Instagram Insights Questions Answered
Even when you know the definitions, the same practical questions always come up. Here are the quick, no-fluff answers to the most common questions about Instagram Insights.
Ready to turn these insights into an automated growth engine? Clepher helps you connect with your audience on Instagram by triggering personalized conversations based on their engagement. Start turning passive viewers into active customers today. Explore what’s possible with Clepher.

Related Posts
How to Customize Your Facebook Page URL: A 2026 Guide to Boost Your Brand
April 5, 2026Chatbots for Banks: The Ultimate Guide for 2026
April 4, 2026Mastering Conversational AI for E-commerce Success
April 3, 2026
Founder Clepher