
You’re staring at three dashboards on Monday morning. Meta reports strong return on ad spend, Google claims a different share of conversions, and your CRM shows that repeat purchases haven’t moved. Then the chatbot report adds a conversion rate that doesn’t reconcile with Shopify or Stripe. Everyone has numbers. Nobody has a dependable answer to the only question that matters: which campaign activity created profitable, incremental business?
Campaign performance analysis isn’t the act of collecting more metrics. It’s the discipline of defining the outcome, connecting every relevant touchpoint, testing the assumptions, and turning the result into a decision. That includes the surfaces many teams still treat as side channels, such as Messenger, Instagram Direct Message, and WhatsApp broadcasts.
Why Most Campaign Performance Analysis Falls Short
The e-commerce manager in that Monday meeting doesn’t have a dashboard problem. They have a measurement design problem. Meta is reporting conversions attributed to ad exposure, Google is applying its own rules, the CRM is counting completed purchases, and the chatbot is treating an opt-in as a conversion. Each system may be internally consistent, yet the combined view is unusable.
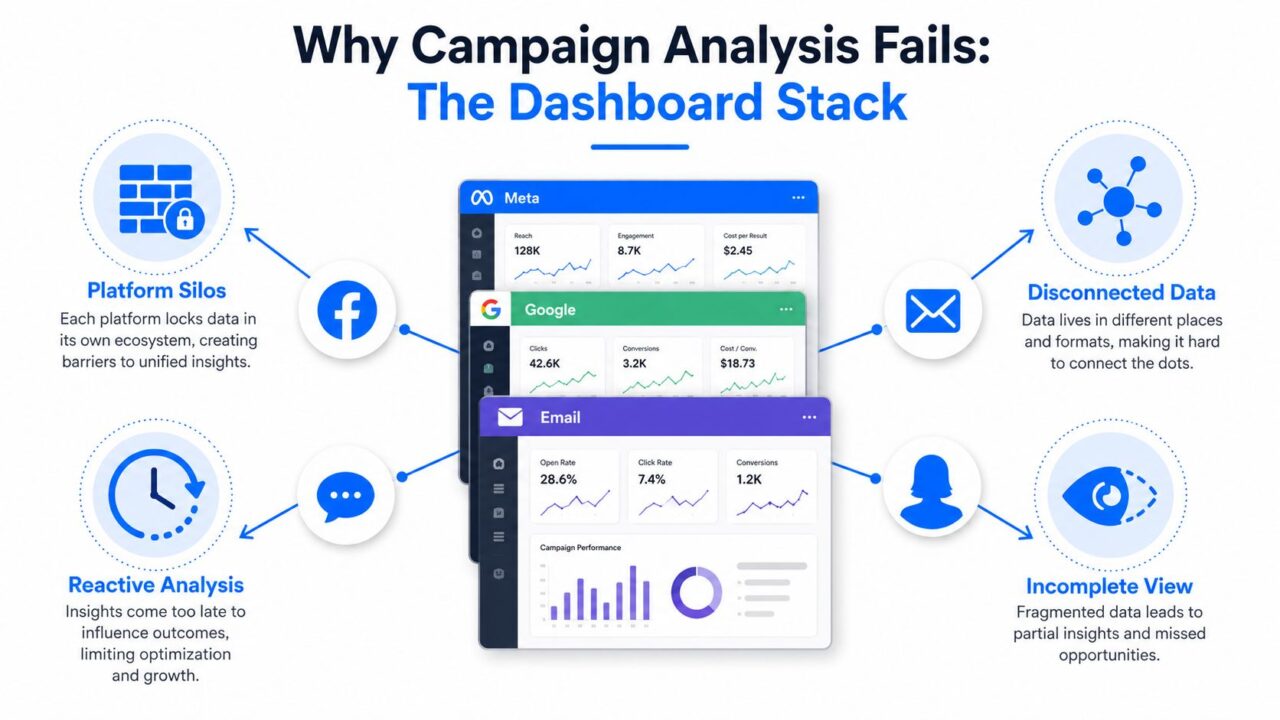
Campaign Performance Analysis Dashboard Stack
Four structural mistakes usually create the conflict:
- Vanity KPI selection: Teams celebrate clicks, opens, downloads, or chatbot engagement even when those actions don’t lead to qualified buyers, margin, retention, or revenue.
- Channel-siloed reporting: Paid media, CRM, email, influencer activity, and conversations sit in separate reports. Nobody can follow a person from ad click to DM reply to checkout.
- Last-click attribution bias: The final recorded click receives credit even when an earlier ad, email, or WhatsApp broadcast created the demand.
- Opaque automation flows: A bot becomes a black box. It reports opt-ins and button taps, but the team can’t see where users drop, which branch creates purchases, or whether the event fires twice.
The proxy-metric problem is substantial. Eighty-seven percent of organizations report that signals such as clicks, downloads, and behavioral scores are unreliable or inflated, while respondents report an average 25% of marketing budget wasted on efforts that fail to drive outcomes. Those findings come from the 2026 performance marketing benchmark, which also reports that 76% of organizations say their content isn’t informed by verified buyer signals, intent data, or performance analytics.
A useful campaign definition includes the audience, offer, entry point, conversion event, measurement window, and downstream business outcome. If a Messenger flow supports a paid-social campaign, it belongs in the same measurement design, not in a separate “automation” report. Teams that need a practical way to inspect creative, messaging, and channel behavior can also use this social media content analysis guide as a complementary review resource.
Practical rule: If two dashboards use different conversion definitions, their reported returns aren’t comparable.
The rest of the playbook fixes those gaps in order. First define success, then unify the data, select the right causal question, test meaningful segments, and build reports that end with an owner and an action.
Setting Goals and KPIs Before You Touch Any Data
Start with the business outcome, not the platform menu. A campaign objective is useful only when it connects to what the company needs to improve, such as revenue, margin, retention, qualified pipeline, or reactivation.
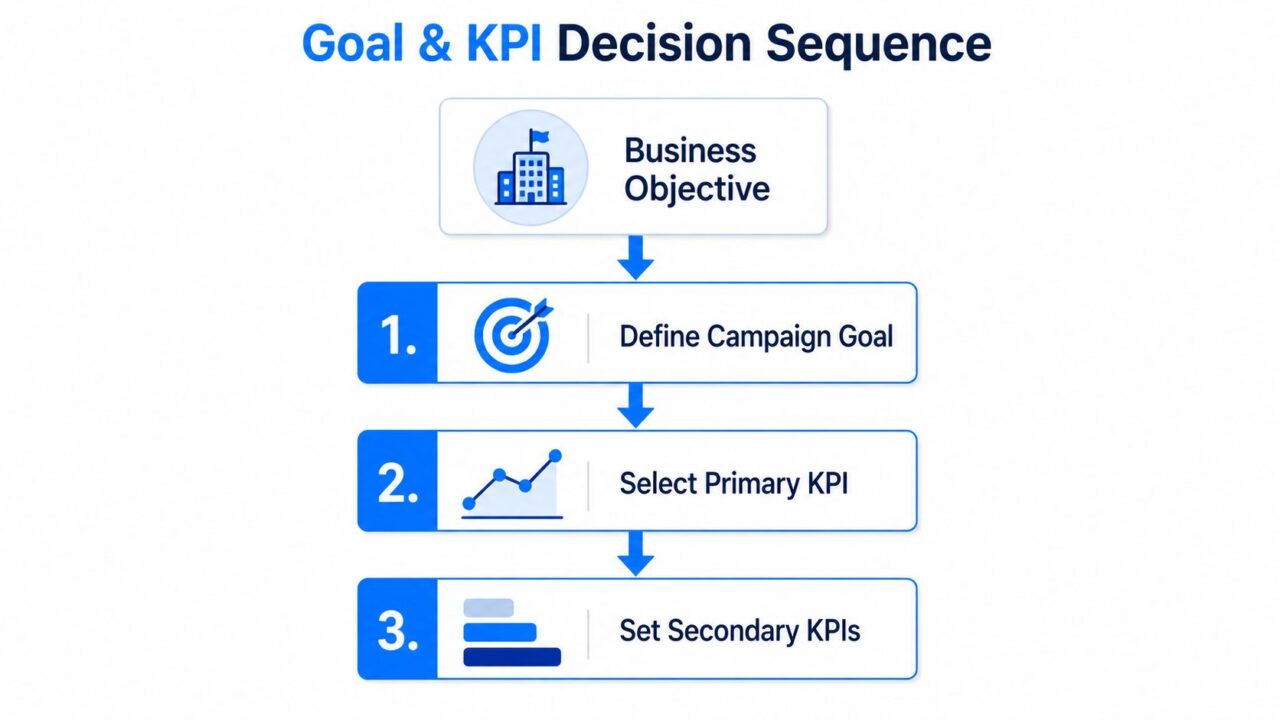
Use this decision sequence:
- Define the business outcome. Decide whether the priority is profitable acquisition, activation, retention, or re-engagement.
- Translate it into a campaign goal. A DTC skincare brand might aim to acquire net new buyers. A B2B agency might aim to increase qualified pipeline velocity.
- Choose two or three KPIs. Select one primary measure and supporting indicators that explain it.
- Set the measurement window. Decide when the campaign will be judged and how long downstream actions have to appear.
For the skincare brand, the primary KPI could be new-customer acquisition cost or contribution margin from first orders. Supporting measures might include conversion rate and repeat-purchase rate. If the brand optimizes for CTR while the landing page already converts efficiently, it may improve a cheap interaction without improving customer economics.
The agency needs a different cascade. Its primary KPI could be qualified pipeline created, with cost per qualified opportunity and lead-to-meeting progression as supporting measures. A click may show interest, but it doesn’t prove that an account is moving toward a retainer.
Messaging channels need their own logic. For a WhatsApp broadcast or Instagram DM sequence, reply rate to the first step may be more useful than a generic engagement rate if the flow’s job is to qualify intent. A broadcast that receives many taps but few meaningful replies may be creating activity without creating sales conversations.
A/B testing adoption reinforces why this discipline matters. An industry summary reports that 60% of companies already use A/B testing and another 34% plan to adopt it, while 77% of marketers use it on websites. Usage is concentrated on landing pages at 60%, email at 59%, and paid search or PPC at 58%, according to the A/B testing statistics summary. The same source reports an average 25% conversion-rate increase among companies implementing A/B testing. Those results don’t justify testing everything. They justify testing decisions tied to a defined outcome.
A one-page KPI cascade
- Business outcome: Increase profitable new-customer revenue.
- Campaign goal: Acquire net new skincare buyers.
- Primary KPI: New-customer acquisition cost or contribution margin.
- Secondary KPIs: Conversion rate, repeat-purchase rate, and qualified checkout volume.
- Measurement window: From first exposure through the agreed post-purchase observation period.
- Decision rule: Scale, iterate, pause, or investigate based on the relationship between acquisition cost and downstream value.
Write this cascade before opening Ads Manager. Otherwise, the first metric you see will become the goal.
Campaign Performance Analysis Decision Sequence
Unifying Data Sources Across Ads, CRM, and Chatbot Flows
Most performance problems are data-plumbing problems disguised as analytics problems. If ad clicks, customer records, conversations, and orders don’t share identifiers and timestamps, no attribution model can repair the journey afterward.
Build the pipeline around three layers. Pull spend, impressions, clicks, and platform events from Meta Ads and Google Ads through native connectors or APIs. Send CRM events such as lead creation, opportunity progression, purchase, refund, and support ticket activity into the same warehouse. Then instrument Messenger, Instagram DM, and WhatsApp flows with campaign IDs, UTMs, click identifiers, conversation timestamps, branch names, and final conversion events.
A practical journey might look like this:
- A prospect clicks a paid-social ad with a campaign-specific UTM.
- The landing page invites the prospect into a Messenger flow.
- The bot records the opt-in, message sequence, branch completion, and checkout link click.
- Shopify or Stripe records the order ID, customer email, phone, revenue, and refund status.
- The warehouse joins the events and distinguishes an opt-in from a completed purchase.
Use order ID, normalized email, and normalized phone as join keys where consent and privacy requirements permit. Keep the original platform IDs as secondary identifiers. The goal isn’t to force every source into one identical schema. It’s to create a trusted event trail with clear definitions.
Common chatbot reporting failures are predictable:
- Conversion on opt-in: The bot fires a purchase event when someone subscribes.
- Double-counted users: The same person enters multiple flows and appears as several conversions.
- Broken handoff: The click reaches checkout, but the campaign ID or conversation timestamp disappears.
- Missing outcome field: The report records button clicks but has no order ID, margin field, or CRM stage.
For most teams, BigQuery or Snowflake paired with Looker Studio or Metabase is enough to establish a shared reporting layer. Agencies managing several clients need stricter separation, reusable schemas, client-level permissions, and standardized naming conventions. A customer-data integration reference can help teams think through the handoffs between marketing systems and operational records, particularly when a customer data integration framework is part of the stack.
| Data Source | Key Identifiers | Integration Method | Common Pitfall |
|---|---|---|---|
| Meta Ads and Google Ads | Campaign ID, ad ID, click ID, UTM parameters | Native connector or API | Comparing platform-attributed conversions directly |
| CRM | Lead ID, account ID, email, phone | Warehouse sync or webhook | Losing lifecycle-stage changes |
| Messenger and Instagram DM | Subscriber ID, flow ID, branch name, timestamp | Bot platform export or API | Counting opt-in as purchase |
| WhatsApp broadcasts | Phone, broadcast ID, message timestamp, reply event | WhatsApp Business API or connector | Measuring delivery instead of qualified response |
| Shopify or Stripe | Order ID, email, phone, revenue, refund status | Native connector or API | Omitting refunds or repeat orders |
Name events before you build charts. “Flow completed” and “purchase completed” are different events, and the distinction determines whether your report measures intent or business value.
Choosing the Right Attribution and Incrementality Model
Attribution and incrementality answer different questions. Attribution asks how to distribute credit across observed touchpoints. Incrementality asks whether the campaign caused additional business that would not have happened otherwise.
Use a simple decision rule. If most spend sits in one channel, platform-native last-click or first-click reporting can diagnose obvious waste. If investment is distributed across four or more meaningful touchpoints, use a consistent position-based or data-driven model in tools such as GA4, Triple Whale, or Northbeam. If the product requires substantial consideration and conversion lag exceeds seven days, add a geo-lift or holdout test before moving budget.
| Model | Best for | Main weakness |
|---|---|---|
| Last-click | Identifying the final conversion touchpoint | Over-credits demand capture |
| First-click | Understanding initial acquisition entry points | Ignores later influence |
| Position-based | Assigning more weight to first and final interactions | Uses fixed assumptions |
| Data-driven | Estimating fractional credit across observed journeys | Depends on clean, sufficiently connected data |
| Incrementality | Proving causal lift through holdouts or experiments | Requires controlled design and operational discipline |
Last-click is useful for a narrow diagnostic. It can show where the final click happened, but it can’t prove that the channel created the demand. Data-driven attribution estimates fractional credit from observed paths, yet it remains dependent on identity resolution and the events your systems capture.
Incrementality is the standard for budget reallocation. A holdout audience, geo test, or carefully designed experiment can compare exposed and unexposed outcomes. That matters as privacy restrictions shorten view-through attribution windows and small data gaps distort return on ad spend.
Messaging channels deserve a specific treatment. A Messenger or WhatsApp broadcast often assists paid social rather than closing the sale directly. Give that touchpoint assisted-conversion credit, then evaluate whether exposed users show stronger downstream outcomes than a suitable comparison group. Don’t force the broadcast to justify itself through direct ROAS when its job is to move a prospect toward a later conversion.
For teams working on attribution for Shopify growth, the practical priority is consistency. Choose one primary model for cross-channel reporting, document its rules, and reserve incrementality tests for decisions that could materially change budget allocation. A useful marketing attribution explanation can support stakeholder alignment, but the model still needs to match the business question.
Decision test: Ask whether you need to know where the sale was recorded or whether the campaign created an additional sale. The first is attribution. The second is incrementality.
Segmenting Audiences and Running Tests You Can Trust
Segmentation and experimentation belong together. A test without a defined audience answers a vague question, and a segment without a test is only an assumption dressed as targeting.
Start with three useful axes:
- Lifecycle stage: Cold prospect, first-time buyer, repeat buyer, or lapsed customer.
- Channel entry point: Paid-social click, DM opt-in, email subscriber, or organic-search visitor.
- Engagement depth: Opened recent broadcasts, abandoned a chatbot flow, completed a key branch, or purchased.
A skincare brand might test a replenishment message only among repeat customers, while excluding people who purchased recently. An agency might separate leads from paid search and Instagram DM because the two groups can have different intent, qualification rates, and follow-up needs.
Build the test before launching it
Write one hypothesis and change one variable. In a chatbot, test the opening message or the first decision branch before rewriting the entire sequence. Drop-off often concentrates at the first interaction, so changing the welcome prompt or initial choice can reveal more than polishing later body copy.
Fix the sample-size requirement before launch with a power calculator. The stated guardrail is 95% confidence and 80% power as the floor, not a reason to stop early. Hold the test through at least one complete purchase cycle so delayed conversions don’t make one variant appear weaker than it is.
Historical results show why patience matters. A 2026 study of 2,408 A/B tests run from January 2023 through March 2026 found that 17.4% reached statistical significance with a winning variant, 8.4% reached significance with a losing variant, and 74.2% were inconclusive or showed no detectable difference, according to the 2026 A/B testing benchmarks. Winning tests had an average lift of 8.4% and a median lift of 6.1%, while losing tests averaged -7.4%, according to the same source.
A separate benchmark reported a median conversion-rate uplift of 1.88% from winning tests and a median revenue-per-visitor uplift of 2.77%, also in the same benchmark source. Modest results still matter when they affect a high-volume campaign, but only if the event definition and audience are trustworthy.
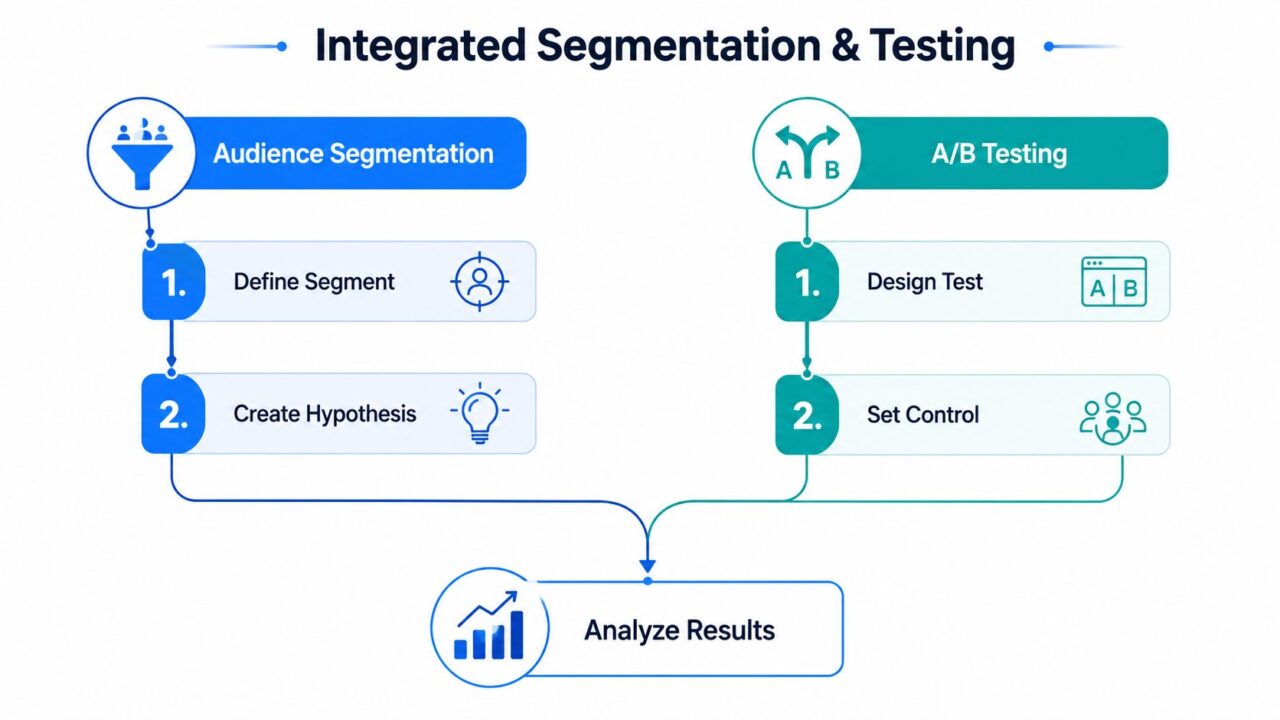
Campaign Performance Analysis Segmentation Testing
Use a customer segmentation strategy framework to document who qualifies, what they saw, which event counts as success, and when the test ends. That record prevents teams from changing the audience after seeing the result.
Visualizing Results and Turning Numbers Into Next Moves
A dashboard should answer a question, not display the work your data team completed. Build each view backward from the decision the team needs to make that week, then remove every metric that doesn’t support it.
For a weekly e-commerce review, use three focused views:
- Blended efficiency trend: Show the seven-day blended ROAS trend with channel annotations so spend changes, creative launches, and tracking incidents have context.
- Full-funnel progression: Track the journey from impressions through first checkout and repeat purchase. Stopping at the first order hides whether new Messenger and WhatsApp subscribers create durable value.
- Cohort revenue: Compare cohorts by entry point and follow their revenue over the agreed observation window. Separate DM opt-ins from email subscribers and paid-social visitors instead of blending them into one average.
For an agency report, replace reach-heavy pages with a cost-per-qualified-conversion chart and a creative-level performance table. Sort the table by spend share so the account team sees where money is concentrated, not merely which small audience has the prettiest rate.
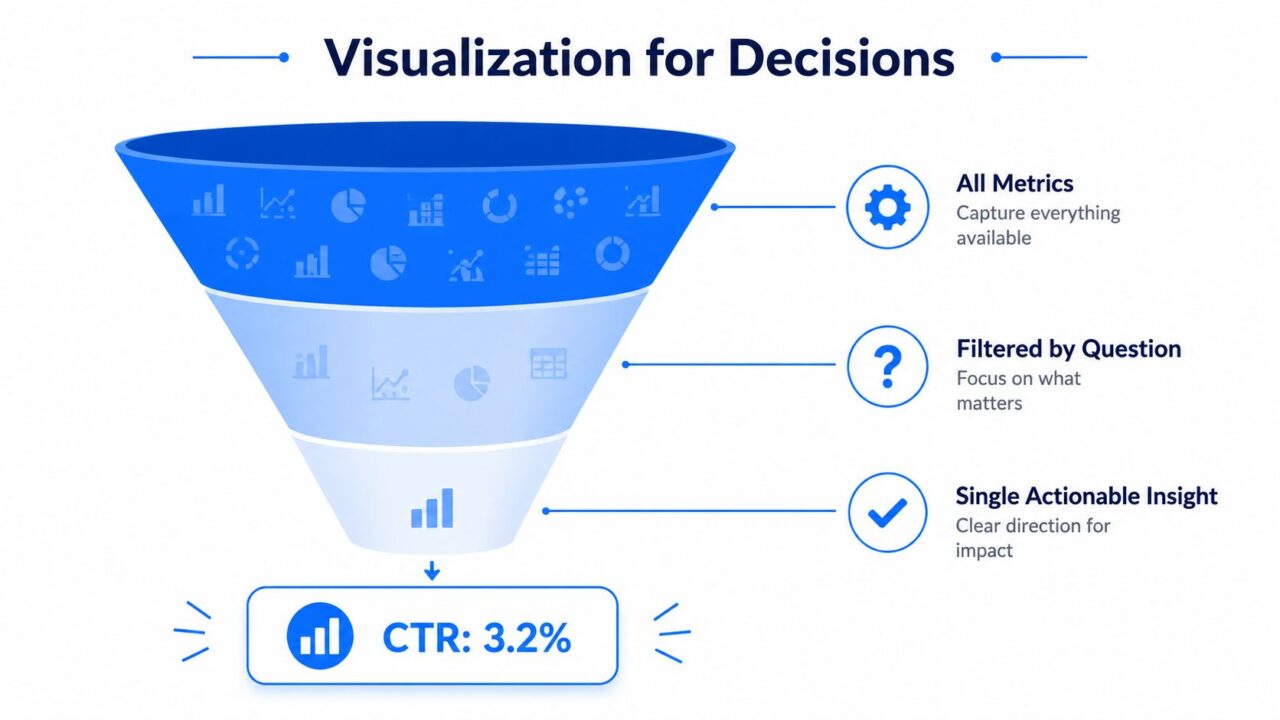
Campaign Performance Analysis Data Funnel
Every chart needs a decision label:
- Pause: The campaign spends against a verified business outcome without a credible recovery hypothesis.
- Scale: The campaign produces efficient outcomes and has room to absorb more budget without weakening quality.
- Iterate: The outcome is promising, but a specific audience, creative, offer, or flow element needs a test.
- Investigate: Tracking, attribution, identity resolution, or data freshness may explain the result.
Plot cost per acquisition against conversion rate in a four-quadrant matrix. This quickly separates efficient converters, expensive converters, low-cost but weak converters, and campaigns that need measurement investigation. Attach an action owner and deadline to every flagged cell.
A reporting resource such as this analytics and reporting guide can help teams structure the reporting layer, but the operating standard is simple: every visualization must end in a documented next move.
If a chart can’t change a budget, message, audience, test, or tracking decision, remove it from the weekly view.
Your 30-Day Campaign Performance Analysis Plan
A month is enough to replace dashboard watching with a repeatable operating rhythm. Keep the sequence tight and make each week produce an artifact the team can use.
Week one sets the measurement foundation
Lock the business goal, primary KPI, secondary KPIs, and measurement window. Audit campaign names, UTMs, event definitions, and identifiers across web analytics, CRM records, ad platforms, Messenger, Instagram DM, and WhatsApp flows. Test every important event from opt-in through checkout, and verify that the purchase event contains the order identifier rather than merely the start of a flow.
Week two establishes the baseline
Choose the attribution model that matches your channel mix and document its rules. Record the current ROAS, CPA, and flow-to-purchase rate as reference points, without treating any one platform’s self-reported number as the complete truth. Identify where incrementality testing could improve a major budget decision, then define the holdout or geo design before reallocating spend.
Week three introduces controlled learning
Run one segmentation experiment and one A/B test per channel where traffic and measurement quality support it. Pre-register the hypothesis, audience, primary KPI, sample-size requirement, confidence and power guardrails, test duration, and stopping rules. For chatbot flows, start with the opening message or first branch, not cosmetic copy changes buried later in the sequence.
Week four turns evidence into operations
Build the weekly dashboard around the questions leadership must answer. Add the four-quadrant decision matrix, assign an owner and deadline to every action, and create a decision log with four fields:
- Change made: What was launched, paused, or altered.
- Observed result: What happened under the agreed measurement definition.
- Interpretation: Why the result is credible, uncertain, or compromised by tracking.
- Next decision: What the team will do and when it will review the outcome.
Repeat these monthly habits:
- Refresh benchmarks: Update the reference view using clean, comparable data.
- Retire weak segments: Remove audiences that no longer produce a meaningful business outcome.
- Archive test learnings: Preserve hypotheses, results, and limitations so teams don’t repeat failed experiments.
- Schedule incrementality work: Reserve a quarterly deep-dive for causal measurement and budget validation.
High-performing analysts write the hypothesis before opening the dashboard. They treat chatbot flows as revenue surfaces, not support tickets, and they make the next decision explicit before closing the report. That habit compounds because every campaign becomes an input to the next decision, not another forgotten export.
Clepher gives teams a no-code way to build and measure conversational Flows across Messenger, WhatsApp, Instagram Direct Message, and websites, with segmentation, broadcasts, A/B testing, and analytics tied to customer journeys. Visit Clepher to connect those messaging surfaces to a more accountable campaign performance analysis workflow.

Related Posts
10 Lead Capture Software Tools Compared for 2026
October 18, 2026WhatsApp Chatbot for Ecommerce: A Practical 2026 Guide
October 17, 2026What Is Lead Scoring and How It Drives Real Sales Results
October 16, 2026
Founder Clepher