Firms that asked customers for feedback and acted on it didn’t just collect nicer scores. In a two-year randomized controlled field experiment, they changed revenue, profit, and buying behavior. That result sets the bar for customer feedback analysis. If your analysis doesn’t end with a different checkout flow, reply, offer, or service fix, it’s reporting, not analysis.
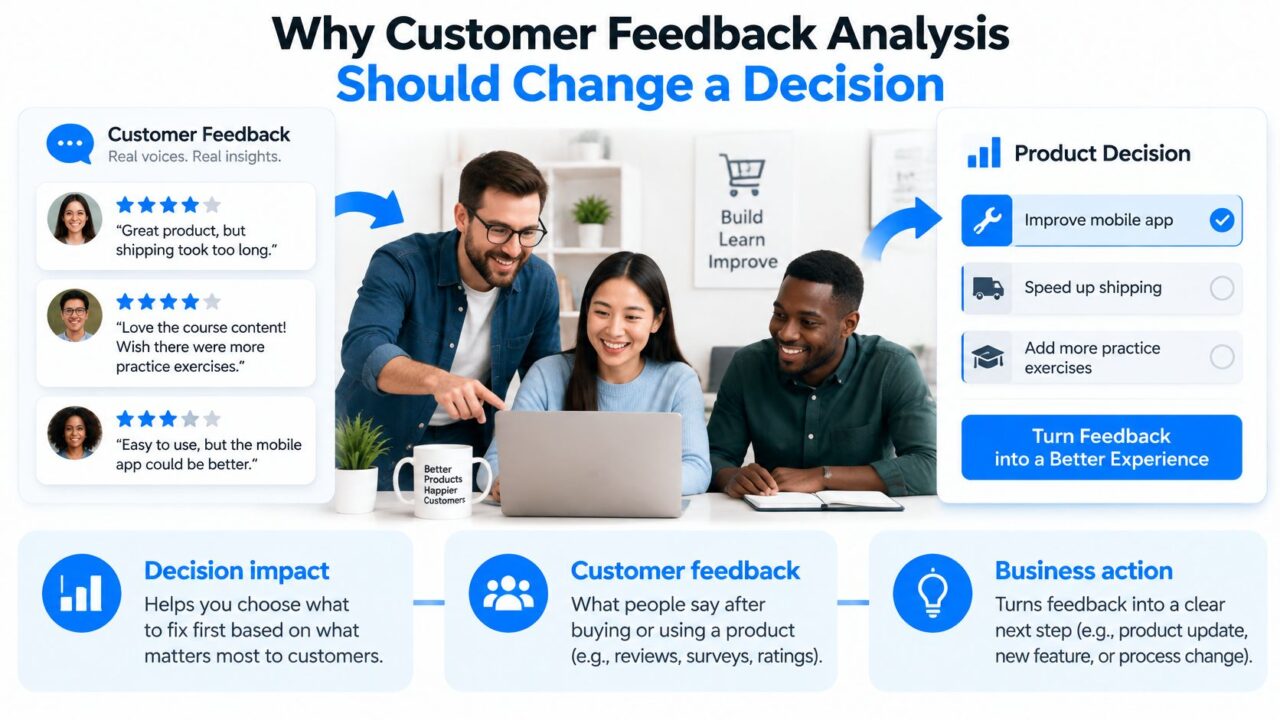
Why Customer Feedback Analysis Should Change a Decision
The Rwanda experiment found firms seeking customer feedback achieved a 62.0% increase in revenue and a 54.5% increase in profit compared with control firms, while nonsolicited customers showed a 38.2% increase in brand recall and a 77.4% increase in purchases, according to the randomized field experiment results. People who never filled in a form still bought more. The firms learned, changed something visible, and the market noticed.
Contrast that with a typical Monday meeting. A DTC team has five-star reviews, a post-purchase survey export, and a Messenger inbox full of sizing questions. A course seller has completion comments and refund emails. Nobody lacks opinions. The meeting still argues from the last angry DM someone read.
Customer Feedback Analysis Product Development
Name The Decision Before You Read The Comments
Useful customer feedback analysis starts with a sentence you can finish. Why does checkout drop after shipping costs appear? Why do new SaaS users stall before the first import? Which complaint is starting to threaten repeat purchases for a local business?
If you can’t name the decision, you’ll code everything and prioritize nothing. Agencies feel this fast. One client wants more leads, another wants fewer support chats, and a blended sentiment chart serves neither.
If a comment can’t change a page, a Flow, a policy, or a reply, it doesn’t belong on this week’s fix list.
What Changes When You Work This Way
You stop asking whether customers feel positive in general. You ask who is missing from the data, which specific aspect they’re rating, and whether a model or a person should own the next step. For teams still relying on scattered interviews, learning how to run customer discovery interviews helps you ask cleaner follow-up questions before you scale the wrong survey.
A coach might learn that buyers praise the lessons but can’t find the worksheets. That’s not a content problem. It’s a navigation fix, one pinned message, and a check on repeat contacts the following week. That’s the path ahead. Decide the question, check representativeness, score themes by aspect, keep explicit requests above model labels, then assign an owner and a deadline you can measure.
Collect Feedback Without Letting the Loudest Voices Win
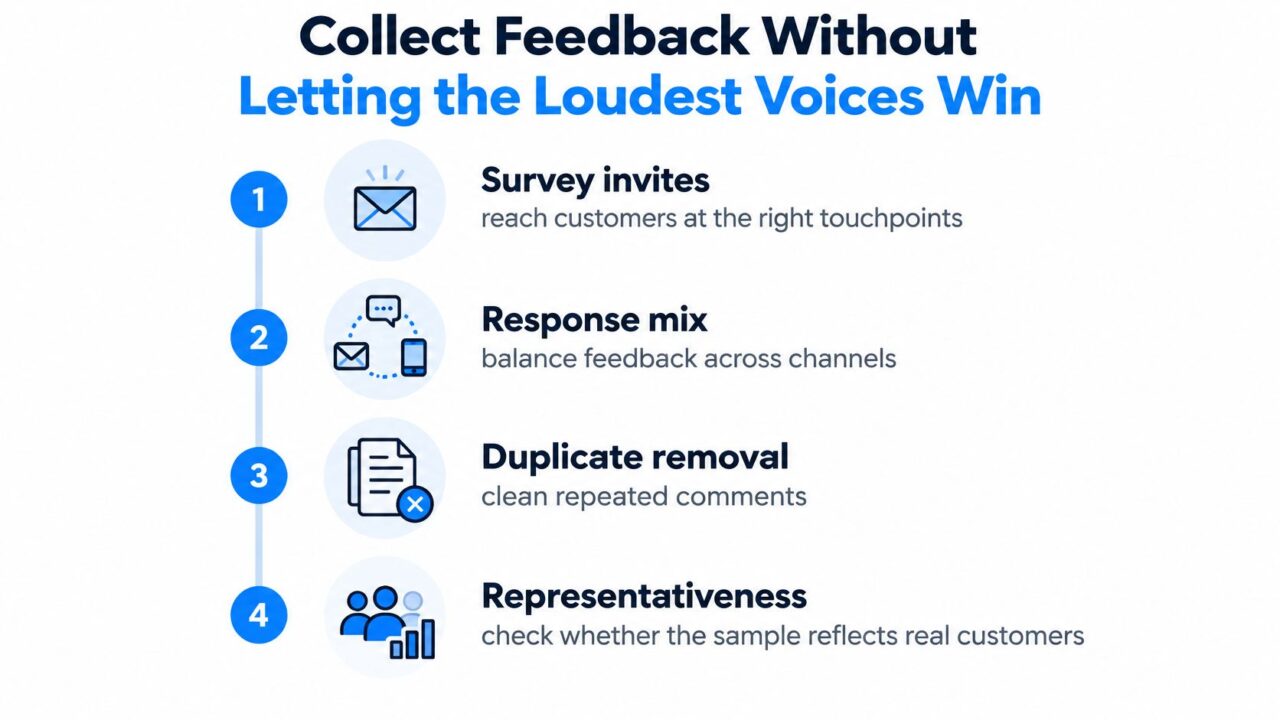
Start where customers already talk. That means website chat, Facebook and Instagram messages, WhatsApp, reviews, post-purchase surveys, and support tickets. Don’t launch a new survey before you’ve cleaned what you have. A practical overview of ways to collect customer feedback across touchpoints can help you map those sources before you add new ones.
Cleaning is unglamorous and decisive. Remove duplicates. Keep one customer’s three follow-ups as one case, not three votes. Keep language, product, and journey stage attached to the text, because a complaint during onboarding means something different from the same words after renewal.
Customer Feedback Analysis Process
Run A Channel Bias Audit
Surveys overrepresent the extremes. Consumer research on feedback representativeness notes that survey-based metrics can systematically overrepresent highly satisfied or highly dissatisfied customers while missing neutral, mixed, or silent experiences, and that customers are giving less feedback after bad experiences. More volume without better representativeness can produce worse decisions.
Build a simple audit before any tagging:
- Source: List each channel separately, from Instagram DMs to Google reviews.
- Who it overrepresents: Note promo buyers, angry refund seekers, power users, or one geography.
- Who is missing: Flag silent repeat buyers, non-English speakers, or customers who churned without contacting you.
- Weight to apply: Compare segments by purchase frequency, lifecycle stage, geography, or language instead of treating every message as an equal vote.
A small but repeated delivery complaint from repeat buyers should outweigh a burst of one-off praise from a giveaway audience. Frequency matters, but so does who is speaking and whether the same issue returns week after week.
This short walkthrough shows how collection choices shape what you can learn later.
Fix The Questions You Do Ask
Pair every rating with an immediate open-text reason. The number estimates magnitude; the words tell you what to fix. Avoid double-barreled questions such as asking whether support was fast and helpful in one item, because you won’t know which part failed.
Use a 95% confidence level with a 5% margin of error as a planning target only, since the sample you need still depends on population size and response bias. Report raw sentiment and a segment-adjusted view side by side. If they disagree, that’s information, not a formatting problem. Drop any question that can’t change a decision.
Turn Ratings and Comments into a Prioritized Fix List
Scores are companions, not contestants. Net Promoter Score asks how likely someone is to recommend you on a 0 to 10 scale, with 0 to 6 as detractors, 7 to 8 as passives, and 9 to 10 as promoters. CSAT covers satisfaction with a specific interaction. CES covers effort. Each answers a different question.
Don’t crown one number. A study covering customers from 93 firms across 18 industries found top-two-box satisfaction was generally the strongest predictor of retention, while the most useful metric varied by industry and level of analysis, as summarized in research linking customer loyalty to growth. Combining metrics improved predictive performance. Your job isn’t to defend a favorite score. It’s to see which score moves with retention, repeat purchase, or referral for your segments.
Score Aspects, Not Whole Comments
Aspect-based analysis fixes the biggest weakness of a blended mood score. A customer can praise delivery and hate product quality in one sentence. One label erases both signals.
A 2025 study analyzed 3,500 Trustpilot reviews across e-commerce shops and extracted 14 distinct aspects, with RoBERTa achieving more than 90% classification accuracy and shop-level test accuracy ranging from 88% to 100%, according to the aspect-based sentiment study. Use that structure even if you’re tagging manually. For each comment, record topic, sentiment for that topic, and intensity.
| Measure | Example | What it tells you |
|---|---|---|
| Support | 0.20 | The pattern appears in 20% of records |
| Confidence | 0.90 | 90% of reviews with those aspects share the same sentiment |
| Aspect pair | Delivery plus late | A specific operational theme, not general unhappiness |
Support and confidence come from that same study, where 0.20 support appears in 20% of records and 0.90 confidence means 90% of reviews containing the relevant aspects share the same sentiment. Read together, they tell you whether an issue is common and consistently negative.
From Tags To A Ranked List
Say delivery plus late shows high frequency and high negative confidence for one region. That goes to operations before a rarer packaging complaint. In chatbot threads, onboarding plus confused might cluster around one step, while sizing plus runs small clusters on one product line. Those need different owners.
Segment every view by product, journey stage, channel, and customer type. A company-wide pie chart hides the warehouse, region, or plan tier causing the pain. Conversation analytics for chat channels earns its place because you can compare themes inside actual conversations instead of guessing from survey averages.
End with two lists. One ranks negative aspects by frequency, intensity, and segment value. The other captures recurring positive aspects you can reuse as proof in replies and broadcasts, after a person checks the wording. That’s a fix list, not a weather report.
When the Model and the Customer Disagree
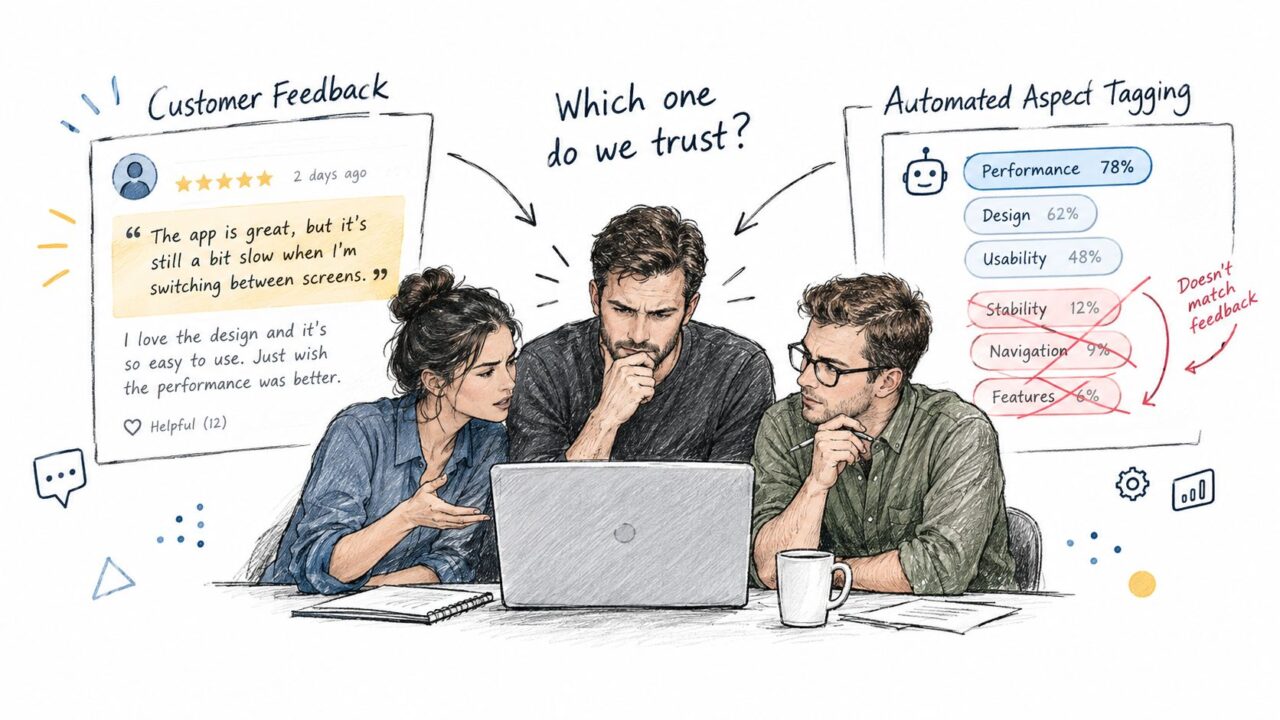
A thread can receive a satisfied tag because the model picks up praise for fast shipping. Yet the same customer may ask for a refund because the product arrived damaged. If automation trusts the tag, it could send a thank-you to someone asking for their money back.
Set one rule where agents can see it: explicit feedback is the source of truth for that individual. Use the model to sort comments, prioritize patterns, and direct attention. A clear customer request takes precedence over an automated label.
The image below captures the gap teams need to plan for: automated tags and a human reading the same thread can point in different directions.
Customer Feedback Analysis Data Discrepancy
Trust Limits Are Part Of The System
Automation affects how customers feel about the use of their data. Digital trust research found 59% of surveyed consumers were uncomfortable with their data being used to train AI, while 77% did not fully understand how brands collect and use their data. The same source notes that organizations commonly respond to survey feedback but miss opportunities to act on neutral and positive comments.
Document consent, retention, and what the model can decide. If customers would not recognize how their messages are being used, clarify the disclosure before relying on the dashboard. Trust shapes how feedback systems should operate.
Where Models Quietly Fail
A single accuracy score can hide predictable misses. Watch for weaker performance on:
- Sarcasm and short DMs: One word or emoji can change the tone.
- Mixed sentiment: A comment may praise support and criticize billing.
- Code-switching and multilingual text: Customers may switch languages mid-thread, especially on WhatsApp and Instagram.
- Rare complaints: Categories with fewer examples can still involve refund, legal, or safety risks.
Use accuracy on your own labeled sample as a rough guide for broad themes, not as permission to automate decisions about individual cases. Model results can vary between runs, so check reproducibility rather than assuming a tag will always be consistent. Keep a versioned taxonomy, fixed settings, a small human-labeled set, and an audit log for changes. Validate with precision, recall, F1 score, and agreement with trained reviewers on your own feedback, not a vendor’s generic figure.
Escalation rule: Refund requests, safety or legal language, repeat complaints, and low-confidence tags go to a person, every time.
Send low-confidence, high-impact, or unfamiliar comments to reviewers. Use their corrections to improve the labels. That feedback loop helps make future tags more reliable without letting a model overrule what a customer explicitly said.
Route Insights into Workflows Teams Actually Run
Three operating models cover many teams. Each can work. Each fails in a predictable place.
A weekly manual read of exports is cheap and builds intuition. It’s also slow, inconsistent between readers, and blind between meetings. A complaint can sit unread while the customer tells someone else.
A spreadsheet taxonomy shared with support adds structure. Tags get more consistent, and you can pivot by product or channel. Someone still has to copy, clean, and chase owners, and delay creeps back in at every handoff.
A conversational system tags live messages and routes exceptions as they arrive. Setup takes more thought up front, but queues stop being invisible. This third model fits teams whose customers already talk on Messenger, Instagram, and website chat, especially when supported by automated customer journey workflows that connect the ask, the tag, and the follow-up.
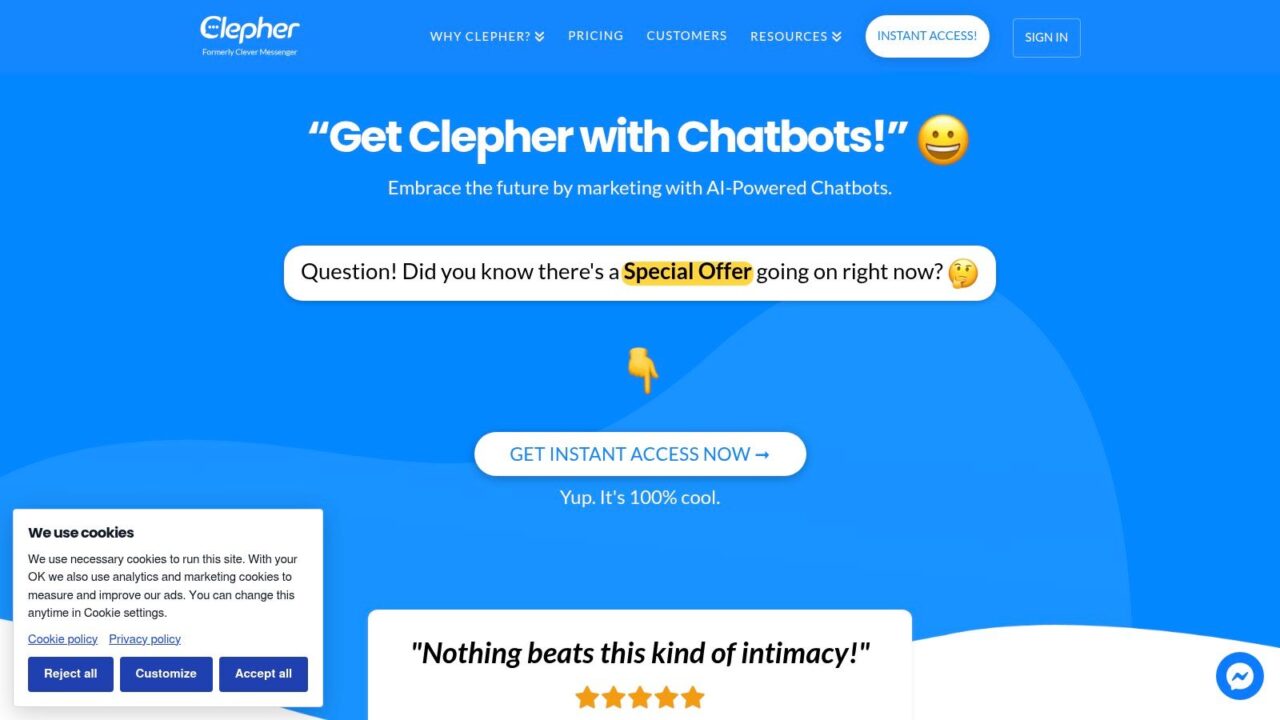
The screenshot below shows the conversational layer where that routing happens.
Customer Feedback Analysis Clepher Chatbots
What The Third Option Looks Like In Practice
Clepher is one example of that layer for website, Messenger, and Instagram conversations. Teams build drag-and-drop Flows, set automation rules, organize contacts with tags and segments, hand off to live chat, and review analytics in one place. Broadcasts and growth tools like the chat widget handle capture and follow-up, and native integrations with 50+ tools, plus Zapier, Make, or Pabbly, bring email or SMS into the loop when chat isn’t enough.
Run it as a workflow, not a feature tour. After a purchase, a short Flow asks for one rating and one open reason. Tags split delivery, product, and billing. High-intensity complaints go straight to a human with order details already collected. Recurring positive aspects, checked by a person, become proof in a segment broadcast.
Put A Clock On Every Complaint
Speed isn’t a courtesy metric. Research on complaint response time and repurchase intent found response delays longer than 17 days were associated with a lower likelihood of retaining the dissatisfied customer, while response time less than three weeks tracked with a higher likelihood of using the company again, and shorter times were positively associated with repurchase intent.
Monitor bands your team can act on:
- Within 24 hours: Your recovery window; measure repeat purchase here.
- Two to seven days: Still recoverable, watch for repeat contacts.
- Eight to 17 days: Escalate now, not at the next weekly review.
- Beyond 17 days: Treat as retention risk and review what blocked the queue.
Compare repeat purchases across those bands. If fast handling doesn’t show up in behavior, your fix isn’t landing. If slow handling does, you’ve found a revenue leak with a timestamp on it.
Start a Weekly Feedback Loop This Week
Pick one decision for the week. Not three. Reducing sizing questions, fixing onboarding drop-off, or clearing refund delays is enough to learn whether your loop works.
Choose one primary channel and one check channel. If Messenger is primary, let reviews or support tickets challenge what Messenger suggests. A single loud inbox shouldn’t set the roadmap, and a second source keeps you honest about who is missing.
Build A Dashboard You Can Read In Five Minutes
Keep four views visible:
- Volume by segment: Product, lifecycle stage, geography, and channel, so averages don’t bury a local problem.
- Top aspects by frequency: Rank themes by support, the share of records each one appears in.
- Low-confidence share: Track how many tags went to humans and what reviewers changed.
- Complaints near the 17-day line: List open cases by age, with an owner on each one.
Assign one owner to the top negative aspect. Ownership means a named person ships a change by a date, not a team that generally cares. If delivery plus late leads, operations owns the carrier fix and support owns the proactive message until it lands.
Habits That Keep The Loop Honest
Quote the customer’s exact words in the ticket. Paraphrases lose the detail that makes a fix obvious, and exact wording helps the next person judge intensity. When the same theme repeats, fix the offer, the page, or the Flow instead of writing a better apology for the tenth time.
A repeated theme is a design flaw with customer documentation attached.
Reuse a verified positive theme in a reply or broadcast only after someone checks context and consent. Positive feedback gets ignored in many programs, yet it tells you what to promise more clearly and which customers might welcome a referral ask.
Launch small inside the chat channels you already run. Build one post-purchase or support Flow, tag the three themes that showed up this month, and set a human handoff for refund language and repeat complaints. Next week, watch two results. Repeat contacts on your chosen issue should fall, and customers handled inside the safer time band should show stronger repeat purchase behavior. Feed reviewer corrections back into your tags, and the loop gets smarter without getting bigger.
Build that first post-purchase or support Flow where your customers already message you, tag every reply by aspect, and route refund or repeat-complaint language straight to a person. Clepher gives you the Flows, tags, live chat handoffs, and analytics to run that weekly loop across your website, Messenger, and Instagram. Start with one decision this week and measure whether the fix changed behavior.