
A DTC founder watches Meta ads approach their CAC ceiling and blames creative fatigue. The campaigns still generate traffic, but each new visitor feels more expensive, checkout conversion has stalled, and the team keeps producing new variations of the same ad. The bigger leak may be post-checkout: weak onboarding, missed upsells, poor repeat-purchase timing, or abandoned carts that nobody follows up with.
That pattern appears in SaaS, agencies, and subscription businesses too. Teams optimize the moment before purchase, then leave the customer lifecycle mostly untouched. Revenue optimization fixes that imbalance by treating every stage, from first visit through expansion and retention, as part of one commercial system.
What Revenue Optimization Really Means in 2026
Revenue optimization is the discipline of maximizing revenue across acquisition, activation, conversion, expansion, and retention. Conversion rate still matters, but it’s only one signal. A customer who converts quickly, buys a small order, cancels soon after, and never returns may improve the dashboard while weakening the business.
That’s why revenue optimization differs from growth hacking and conventional CRO. Growth hacking usually starts with a tactic, such as a new referral loop or ad format. CRO focuses mainly on turning existing website traffic into more immediate conversions. Revenue optimization borrows the strongest parts of both, then adds pricing discipline, cohort analysis, customer segmentation, and lifecycle messaging.
A practical program asks four questions:
- Acquisition: Which sources bring visitors or leads with commercial intent?
- Activation: What gets a new customer to experience value quickly?
- Expansion: What relevant upgrade, add-on, or bundle can increase account value?
- Retention: What prevents avoidable churn and creates the next purchase?
The hotel industry provided an important historical example. IHG’s price optimization system was estimated to produce 2.75% to 6% revenue uplift in the retail segment, while a beta test across properties showed a 2.7% increase in REVPAR. For properties using the module over 12 months, that REVPAR increase translated into about $145 million in incremental revenue, as documented in this hotel price optimization case study.
The 2026 operating environment makes this broader view more important. Third-party signal loss increases the value of first-party data, while margin pressure makes blended revenue per visitor more useful than sessions alone. Conversational AI can help capture intent directly, but only if teams connect those conversations to product, order, and retention data.
Practical rule: Optimize the customer relationship, not just the click that starts it.
The Core Metrics That Drive Revenue Decisions
A revenue dashboard should give marketing, product, sales, and finance a shared language. Four KPI families cover most of the decisions that matter, but none should be read in isolation.
Revenue per visitor
Revenue per visitor, or RPV, combines traffic quality, conversion probability, and order value. It helps a marketing team see whether a campaign attracts commercially valuable visitors, while merchandising can see whether pricing, bundles, or recommendations improve the value of that traffic.
RPV is more useful than conversion rate alone for experimentation. In a 2026 benchmark synthesis, winning A/B tests produced a median +2.77% RPV uplift and a median +1.88% conversion-rate uplift, while the top quartile reached +5.21% or higher RPV improvement, according to A/B testing benchmarks for 2026. A test can increase conversion while reducing basket size, so RPV should lead and conversion rate should diagnose.
LTV and CAC
LTV:CAC tests whether customer value can support acquisition cost. Use it by channel, product, cohort, and customer type rather than relying on one blended ratio. A paid social campaign can look efficient overall while producing customers with weak repeat behavior.
The hidden risk is payback timing. A high LTV estimate based on distant future purchases can make an acquisition program look healthy before the cash returns. Track contribution margin and payback alongside the ratio.
Conversion rate
Conversion rate exposes friction across landing pages, product detail pages, checkout, pricing pages, sales demos, and trial activation. Break it down by source, device, landing path, offer, and customer segment. Blended conversion can improve because the traffic mix changed.
Teams that need a deeper framework for interpreting marketing data can use this guide to understand analytics in marketing.
Net Revenue Retention
NRR measures expansion minus churn and contraction within an existing customer base. It’s especially useful in SaaS because it shows whether accounts become more valuable after the initial sale.
NRR can hide concentration risk. A small number of large expansions may offset widespread downgrades, so pair NRR with account-level distributions, product usage, renewal behavior, and customer concentration.
| Metric | What It Tells You | Where It Lies |
|---|---|---|
| RPV | Whether each visitor produces enough revenue | Can hide declining repeat purchase or retention |
| LTV:CAC | Whether acquisition economics can support growth | Can rely on uncertain future value or ignore cash timing |
| Conversion rate | Where visitors or leads encounter friction | Can rise while order value or lead quality falls |
| NRR | Whether existing accounts expand or contract | Can conceal concentration risk and broad account weakness |
The Five Levers That Move Revenue
Revenue programs often fail because teams choose a familiar lever instead of the most valuable constraint. Pricing, packaging, CRO, segmentation, and expansion work together, but each answers a different commercial question.
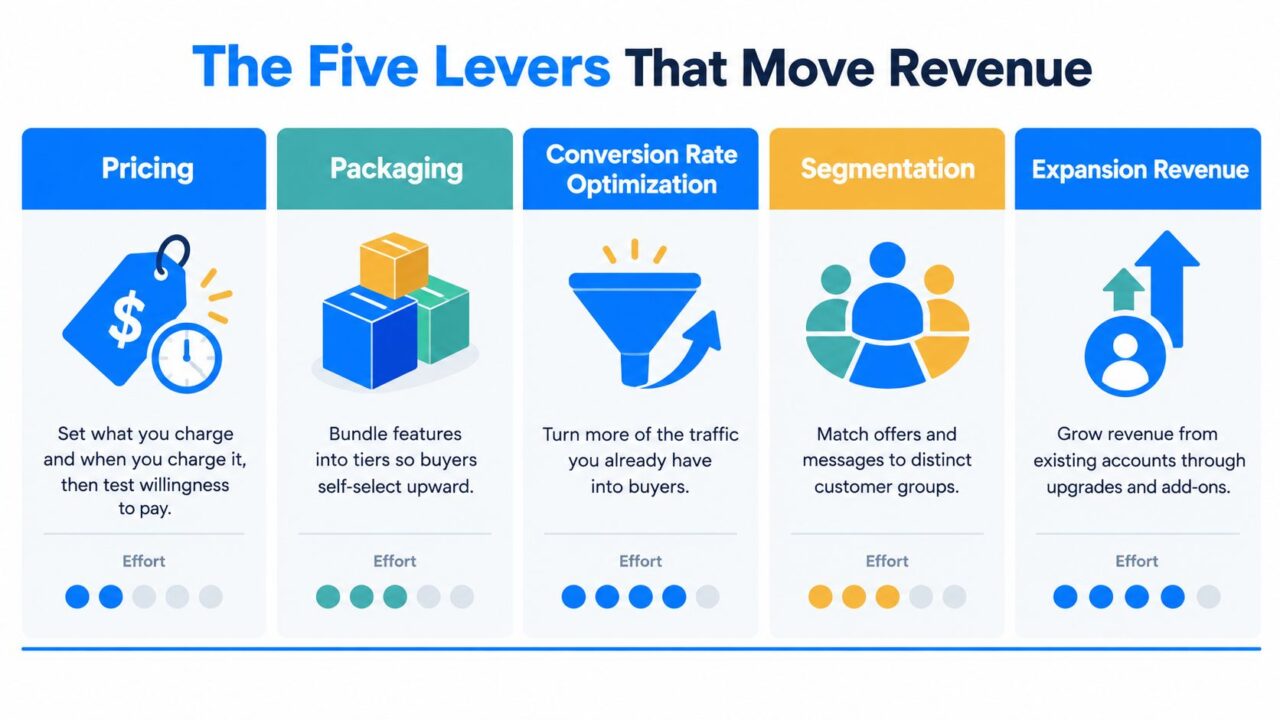
Revenue Optimization Business Levers
Pricing
Pricing asks what should we charge, and when should we charge it? Test anchoring, discount cadence, billing frequency, and offer timing. A discount can create a short-term conversion lift while training customers to wait, so evaluate margin, repeat behavior, and refund activity too.
Price optimization can produce a 3% to 15% revenue uplift, according to a pricing A/B testing analysis. For a business with $10M ARR, that range implies approximately $300K to $1.5M in additional annual revenue without increasing acquisition spend.
Packaging
Packaging defines what buyers receive. Tiered bundles reveal willingness to pay more clearly than one flat offer, especially when each tier has a distinct job. An e-commerce brand might create starter, routine, and complete bundles, while SaaS teams can separate collaborative features from advanced automation.
Conversion rate optimization
CRO asks why existing visitors aren’t buying. Start with the largest friction point, such as unclear product benefits, weak proof, shipping surprises, slow checkout, or a pricing page that forces unnecessary comparison work.
Segmentation
Segmentation decides who receives which message. Use lifecycle stage, purchase history, recency, frequency, monetary value, product interest, and declared intent. The objective isn’t more campaigns. It’s fewer irrelevant messages.
Expansion revenue
Expansion asks how current customers can spend more for a reason that makes sense. Use replenishment reminders, cross-sells, upgrades, usage-based prompts, and account reviews. For teams that need human help qualifying commercial opportunities, hire appointment setters to support the handoff from marketing intent to sales conversation.
These levers aren’t alternatives. A strong program might improve packaging first, remove checkout friction second, and then use segmentation to present expansion offers to customers who’ve already demonstrated product value.
How Chatbots and AI Agents Power Revenue Growth
Conversational AI becomes valuable when it’s attached to a revenue event. A chatbot that only answers generic questions may reduce support workload, but a flow that captures intent, recommends the right offer, and hands off high-value conversations can influence the entire customer lifecycle.
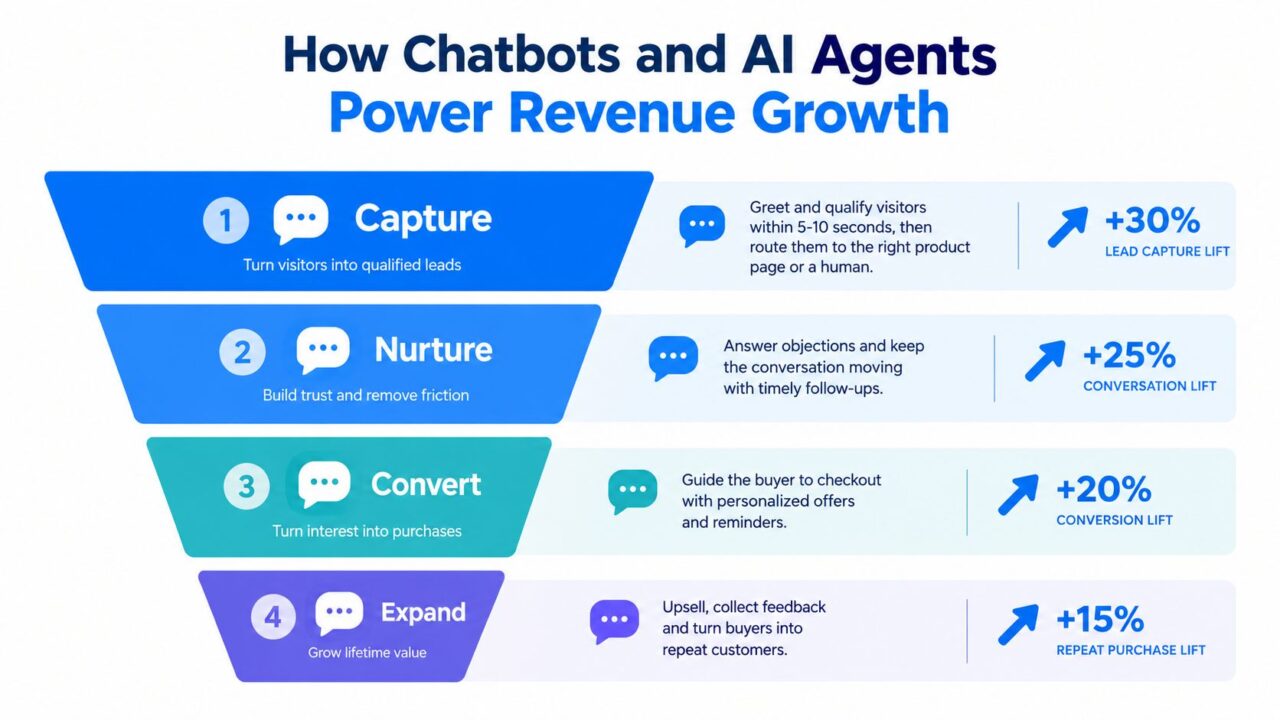
Revenue Optimization AI Funnel
Capture intent early
Greet visitors quickly, ask one useful qualifying question, and route them to the correct product or person. Entry conditions might include landing-page context, returning-visitor status, referral source, or a product category viewed.
Branch by intent. A visitor asking about compatibility should see product guidance. A visitor asking about implementation should reach a sales path. A visitor with a complex complaint should skip automation and reach a human.
Nurture with context
Follow-ups should reflect the conversation, not repeat a generic broadcast. Tag visitors by interest, concern, use case, and lifecycle stage, then send relevant education, comparisons, reminders, or proof.
A SaaS flow might branch between solo users and larger teams. An e-commerce flow might recommend a routine based on the products viewed and the customer’s stated goal. The exit condition should be explicit, such as purchase, booked call, reply, or human handoff.
Convert by removing friction
Use conversational flows to answer objections about price, delivery, setup, integrations, and cancellation. If the buyer has a qualifying cart value or high purchase intent, offer a clear next step rather than forcing them through a long scripted exchange.
Clepher-style flows can handle entry conditions, intent branches, personalized fields, fallback routes, and exit goals. Teams evaluating an AI sales workflow can review an AI agent for sales as one possible approach.
Recover and expand
Cart recovery should feel like service, not pressure. A first message can remind the customer what they selected, a later message can answer a likely objection, and a final message can offer human assistance or a relevant incentive when the economics support it.
After purchase, use conversational prompts for setup, feedback, replenishment, add-ons, and upgrades. The warning is simple: don’t automate refunds, serious complaints, or complex B2B negotiations without a human path. A poor automated interaction can damage lifetime value faster than it improves first-order conversion.
Building a Measurement and Experimentation Plan
Start with one primary KPI: revenue per visitor. It gives pricing, merchandising, acquisition, and lifecycle teams a common outcome. Add profit per visitor where discounts, fulfillment, returns, or support costs vary materially.
Then build cohorts. Compare customers by acquisition source, product line, landing path, first offer, and purchase month. A promotion that creates a short-lived revenue spike should not receive the same investment as a change that improves repeat value.
Run a balanced test portfolio
Keep one test in each major decision area:
- Pricing test: Compare a price, billing, bundle, or discount hypothesis. Watch RPV and contribution margin.
- CRO test: Improve a product page, checkout step, pricing page, or lead form. Watch RPV and conversion rate.
- Lifecycle test: Change onboarding, cart recovery, replenishment, or expansion messaging. Watch RPV, repeat purchase, retention, or NRR.
Every test needs a hypothesis, a defined audience, a sample-size requirement, and a decision rule. Don’t stop a test because an early dashboard looks exciting. For subscription pricing, one methodology recommends tracking cohorts for 6 to 12 months, using early signals such as week-1 conversion and later signals such as month-6 retention and NRR, as explained in this subscription pricing experimentation methodology.
Use guardrails to prevent local wins from damaging the business. Monitor AOV, refund rate, support tickets, cancellation, gross margin, and lead quality alongside the primary KPI.
| Test Type | Cadence | Primary KPI | Guardrail Metric | Read Window |
|---|---|---|---|---|
| Pricing | Ongoing rotation | RPV or profit per visitor | Refund rate, margin | Defined by cohort maturity |
| CRO | Regular sprint | RPV | AOV, checkout errors | After required sample size |
| Lifecycle flow | Continuous iteration | Repeat revenue or NRR | Unsubscribes, complaints | Cohort-based |
| Packaging | Periodic review | RPV or expansion revenue | Mix, support load | Long enough to observe upgrades |
A useful portfolio split is 70% proven plays, 20% adjacent bets, and 10% moonshots. It protects the roadmap from becoming either reckless experimentation or endless maintenance.
Real-World Wins From E-commerce, Agencies, and SaaS
The strongest revenue programs usually involve a trade-off. The team gives up simplicity, speed, or a familiar reporting metric to improve the economics that matter later.
E-commerce
A DTC skincare brand rebuilt its pricing ladder into a three-tier bundle and added cart-recovery broadcasts at the four-hour and 24-hour marks. The program recovered 11% of abandoned carts and lifted RPV by 18% in one quarter. The trade-off was operational complexity: the brand had to maintain bundle logic, inventory rules, and more specific recovery messaging.
The abandoned-cart workflow became part of the commercial experience rather than an afterthought. Teams building a similar system can use a dedicated abandoned cart recovery flow to connect reminders with customer intent.
Agency
A performance agency replaced ROAS as its client-facing North Star with RPV. It rebuilt reporting and retainer conversations around the value generated by each visitor, then achieved a 23% upsell on retainer fees within two renewal cycles. The cost was uncomfortable client education, because a campaign could show lower ROAS while producing stronger downstream revenue.
That shift gave the agency a better basis for recommending landing-page, pricing, and lifecycle work instead of treating paid media as an isolated channel.
SaaS
A B2B software company replaced a flat free trial with segmented onboarding triggered by company size and use case. Trial-to-paid climbed from 14% to 27%, and NRR crossed 115% after expansion campaigns gained cleaner targeting data. The trade-off was a larger implementation burden, including event taxonomy, branching logic, and more onboarding content.
These examples share the same arc: identify the commercial leak, choose a measurable lever, and accept the operating complexity required to improve the whole system.
Your Revenue Optimization Implementation Checklist
A 90-day rollout should create evidence quickly without pretending that every answer will appear in the first sprint.
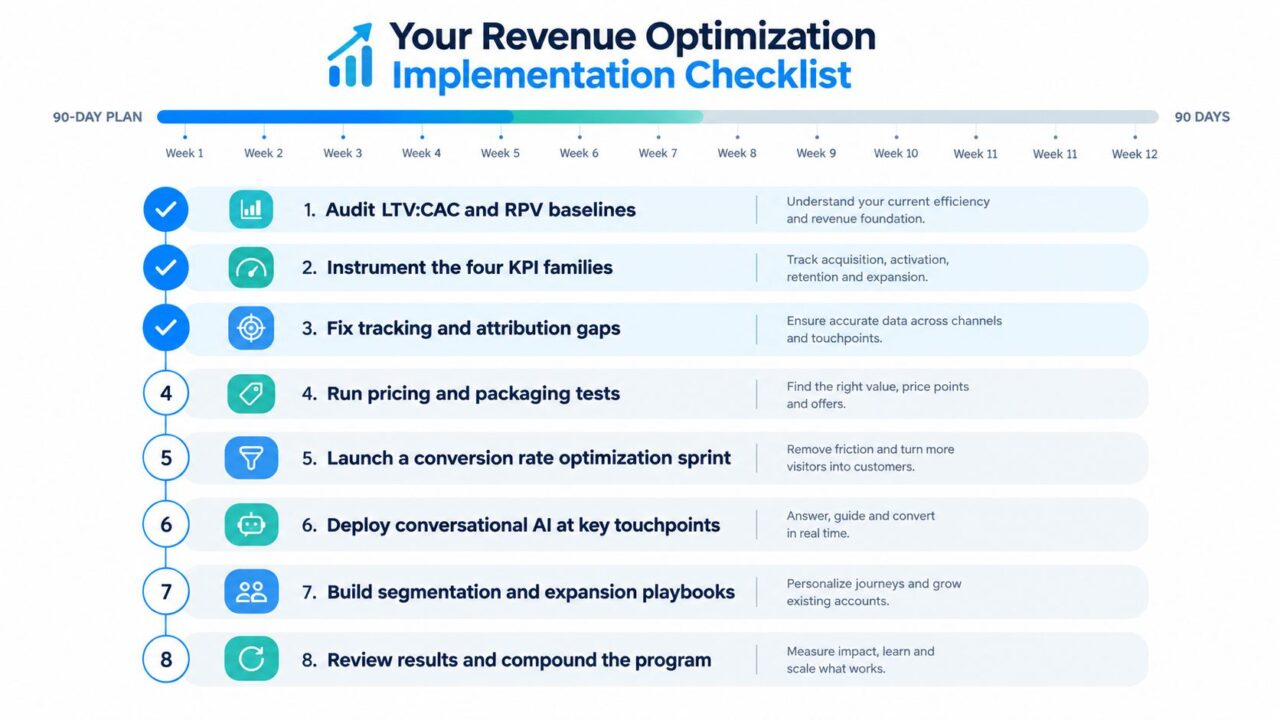
Revenue Optimization Checklist
-
Audit the baseline. The growth lead or finance owner should document LTV:CAC, RPV, conversion, repeat purchase, churn, and expansion by channel or customer type. Deliverable: a baseline dashboard and a list of missing inputs.
-
Instrument the four KPI families. Analytics, product, and marketing should agree on definitions for RPV, LTV:CAC, conversion rate, and NRR. Deliverable: one metric dictionary that prevents teams from calculating the same KPI differently.
-
Fix attribution gaps. Assign ownership for source, landing path, campaign, product, and lifecycle events. Deliverable: a trustworthy path from acquisition through revenue.
-
Choose the largest leak. Select one problem, such as checkout friction, weak trial activation, poor bundle mix, or early churn. Deliverable: a written hypothesis and a two-week experiment plan.
-
Run pricing and packaging tests. E-commerce teams can test bundles and discount cadence. SaaS teams can test pricing-page structure or billing options. Agencies can package strategic and execution services around client revenue outcomes.
-
Launch a CRO sprint. Give a designer, copywriter, developer, and analyst one clearly defined conversion problem. Track RPV as the commercial outcome, not just button clicks.
-
Deploy conversational and expansion flows. Add capture, onboarding, cart recovery, reactivation, upsell, or account-review paths. Keep human escalation available for sensitive or high-value conversations.
-
Review and compound. At the end of the rollout, record winners, losers, guardrail effects, and unanswered questions. E-commerce teams should prioritize checkout and bundle pricing, agencies should build client LTV dashboards and upsell scripts, and SaaS teams should connect pricing-page tests to expansion plays.
Assign a quarterly review owner before the first experiment launches. Revenue optimization decays when tracking definitions, offer logic, and lifecycle segments remain unchanged while customer behavior moves on.
Mindset Shifts That Compound Into Long-Term Revenue
Three shifts separate teams that grow revenue from teams that only report it.
First, own the full lifecycle. Acquisition matters, but activation, expansion, and retention determine whether the first sale becomes durable value. Treat post-purchase conversations as part of revenue work, not merely customer support.
Second, treat pricing as a product decision. Pricing affects positioning, packaging, demand quality, margin, and customer expectations. Review it continuously, use holdouts where appropriate, and judge changes by customer value rather than immediate conversion alone.
Third, instrument before optimizing. If RPV and cohort LTV aren’t trustworthy, experiment results will produce confident but unreliable decisions.
Start this week with RPV by traffic source and landing path. That view forces the team to discuss dollars instead of sessions, and it reveals which acquisition journeys deserve more traffic, better offers, or a complete redesign.
Clepher helps businesses use chatbots, AI Agents, segmentation, live chat, broadcasts, and analytics to capture intent, nurture prospects, recover lost sales, and support expansion across website and social messaging channels. Visit Clepher to connect conversational flows with a practical revenue optimization program.

Related Posts
Revenue Optimization: A Practical Playbook for Growth
October 19, 202610 Lead Capture Software Tools Compared for 2026
October 18, 2026WhatsApp Chatbot for Ecommerce: A Practical 2026 Guide
October 17, 2026
Founder Clepher