
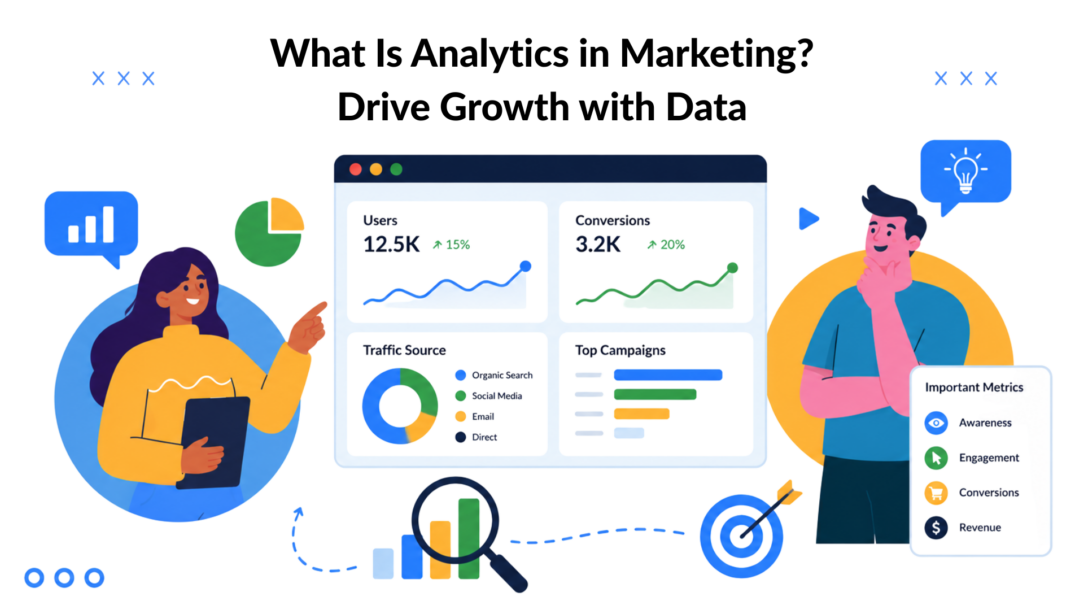
Many e-commerce owners are sitting on plenty of marketing data and still feel unsure about the next move. Reports pile up. Decisions do not get easier.
If you’ve looked at clicks, sessions, open rates, and conversions and thought, “I have numbers, but I still don’t know what to do next,” the problem usually is not effort or intelligence. It is that marketing analytics often gets explained in a way that fits large teams with analysts, custom dashboards, and time to sort through every report.
For a smaller or non-technical team, analytics should work more like a detective’s case board. You are not collecting every possible clue. You are connecting the clues that explain what leads to sales, repeat purchases, and stronger customer relationships.
That matters even more in e-commerce because part of the story often lives outside classic dashboards. A shopper might click an ad, browse your store, ask a question in Messenger or WhatsApp, and buy later. If you only measure the click and the purchase, you miss the conversation that helped close the sale.
Good marketing analytics helps you answer practical business questions without code or a data science background. Which channel brings buyers, not just traffic? Which campaign burns budget without producing revenue? Which messages get ignored, and which ones start real conversations that lead to loyalty?
Used this way, marketing analytics becomes less about reports and more about better decisions.
Why Digital Marketing Analytics Feels Overwhelming and How to Fix It
About two-thirds of marketers say the hardest part of analytics is turning numbers into action. For a store owner, that feels like checking five dashboards, seeing fifty metrics, and still ending the day unsure whether to change the ad budget, rewrite an email, or follow up with customers who asked questions in WhatsApp.
The overload usually starts because analytics gets introduced as a stack of tools instead of a way to make decisions. A better starting point is the business question in front of you. Which campaign should get more budget? Which audience buys at a higher rate? Which message brings first-time shoppers back for a second order?
Marketing analytics works like a detective’s case board. Each metric is a clue, not the final answer. Traffic, clicks, purchases, email replies, and chat conversations only become useful when you connect them to one business outcome such as revenue, repeat orders, or customer loyalty.
Why non-technical teams get stuck
Non-technical e-commerce teams often have plenty of information, but it lives in separate places and speaks different languages.
Shopify shows sales. Google Analytics shows visits and product views. Meta shows ad clicks and cost. Your email platform shows opens and clicks. Messenger, Instagram DMs, and WhatsApp hold the questions, objections, and buying signals that often explain why someone purchased or disappeared.
When those pieces stay disconnected, analytics feels harder than it needs to be. You are trying to solve a case with half the notes on one desk and half on another.
Simple rule: Keep a metric on your main dashboard only if it helps you decide what to keep, fix, pause, or test.
That rule cuts through a lot of noise. A high click-through rate may look encouraging, but it matters less if those visitors never buy. A lower-volume channel may deserve more attention if it produces repeat customers or starts conversations that lead to later sales.
The fix is smaller than it looks in Analytics Tool
You do not need code, a data team, or a custom reporting setup to get useful answers. You need a small system your team can use every week.
Start here:
- Pick one goal first. Use revenue, first purchases, repeat purchases, or retention.
- Choose a short list of supporting metrics. For example, track ad spend, conversion rate, cost per purchase, and repeat purchase rate for that goal.
- Include conversation touchpoints. Log common questions and sales chats from Messenger or WhatsApp alongside website and campaign data.
- Review the numbers while you can still act. Weekly is often enough for a growing e-commerce brand.
This no-code approach helps smaller teams avoid a common blind spot. Many guides treat marketing analytics as website traffic plus ad performance, but real buying journeys are messier. A shopper may click an ad on Tuesday, ask about sizing in Instagram messages on Wednesday, and purchase from a WhatsApp link on Friday. If you ignore the conversation, you miss part of what created the sale.
That is why practical analytics is less about collecting every datapoint and more about building a usable view of customer behavior across channels. Teams that want a stronger framework for unlocking growth with data strategies often see better results when they combine campaign metrics with direct customer conversations, especially in e-commerce where chat can influence trust, conversion, and repeat buying.
What Marketing Analytics Tools Really Mean for Your Business
Marketing analytics is the process of turning marketing activity into clear business decisions.
For a non-technical e-commerce team, that means pulling together signals from your store, ads, email platform, and even customer conversations, then using them to answer practical questions. Which campaign brings paying customers? Which product page creates interest but loses shoppers? Which messages lead to repeat orders, not just clicks? Answering these well is what separates data-driven marketing from guesswork, and it is what lets you compare marketing strategies on results instead of instinct.
Analytics works like a detective on a case. One clue alone rarely solves anything. A spike in traffic, a drop in conversions, or a burst of WhatsApp questions only becomes useful when you put the clues together and see what they point to. This is where digital marketing analytics earns its keep, connecting scattered signals into a single picture of what is actually working. The right analytics tool does not just report numbers; it shows you where your marketing efforts are paying off and where they are quietly wasting budget. Choosing a marketing analytics tool built for e-commerce means you get these answers without needing a data team to interpret them for you.
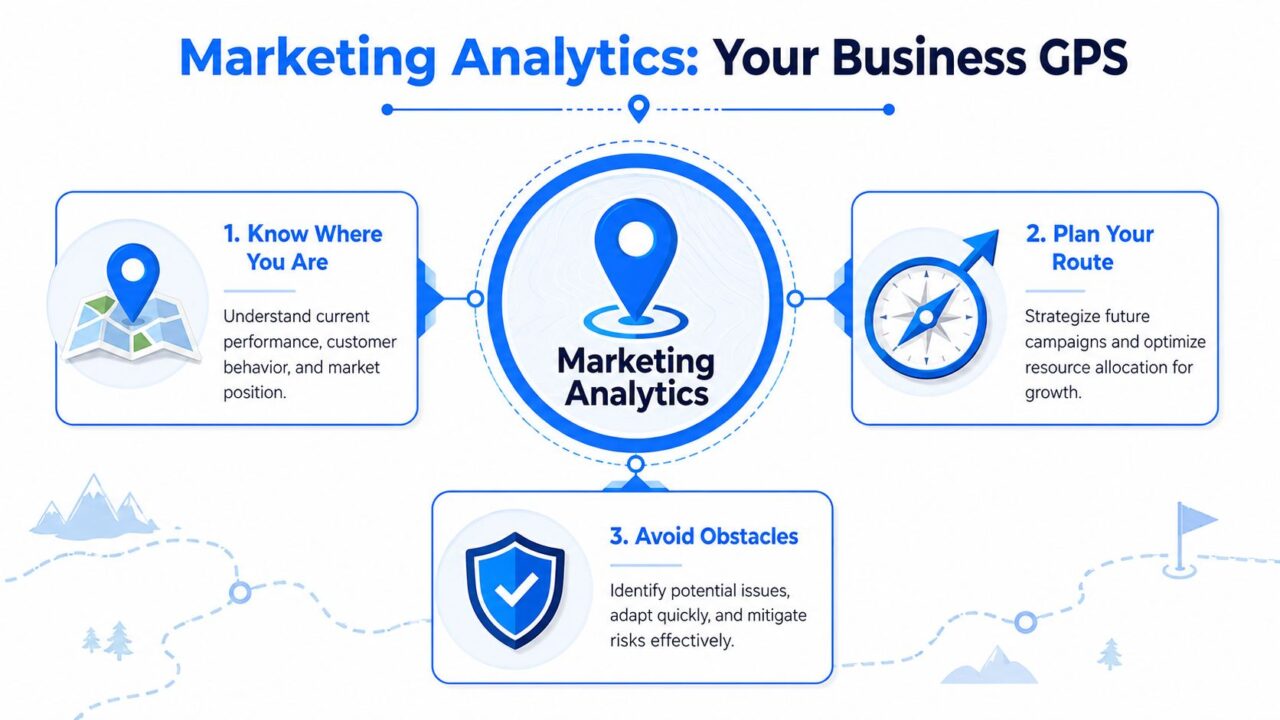
Analytics in Marketing Infographic
From raw metrics to real decisions with marketing data
A metric on its own is just a number.
Say your store gets more traffic this week. That sounds promising, but traffic only helps your business if it leads to product views, add-to-carts, purchases, or stronger customer retention. Analytics adds the missing context, so you can connect activity to outcomes that affect sales.
For example:
- A rise in traffic is encouraging if the conversion rate stays steady or improves.
- A high click-through rate can waste budget if those visitors leave quickly or never buy.
- A smaller campaign can be your strongest performer if it brings in higher-value customers.
- A busy Messenger or WhatsApp inbox may signal buying intent, especially if those conversations lead to purchases later.
The goal is not to stare at dashboards longer. The goal is to make better choices with less guesswork.
Marketing analytics is the practice of finding patterns in your marketing and customer data so you can see what is working, what is underperforming, and what to change next.
What it looks like in day-to-day marketing
In real business terms, marketing analytics helps answer questions like these:
- Product page performance: Which pages get attention but fail to turn interest into orders?
- Campaign quality: Which ads bring buyers instead of casual browsers?
- Customer segments: Which shoppers respond better to bundles, discounts, or restock alerts?
- Conversation impact: How often do Messenger or WhatsApp chats help someone move from hesitation to purchase?
- Retention signals: Which follow-up messages bring customers back for a second or third order?
That last point is easy to miss. Many analytics explainers stop at website behavior and ad performance. E-commerce buying journeys are often messier than that. A shopper may click an Instagram ad, ask a sizing question in WhatsApp, then purchase from a link shared in chat two days later. If your reporting ignores the conversation, you lose part of the story behind the sale.
If you’re working on unlocking growth with data strategies, keep this principle in mind. Data collection is only useful when it helps your team choose smarter actions without needing a complex setup or a technical analyst.
Why this matters more now
Many teams have access to more numbers than ever, but more numbers do not automatically lead to better decisions. Views, impressions, and likes can be useful signals, yet they do not always tie back to revenue, repeat purchases, or customer loyalty.
Good marketing analytics filters out the noise. It helps you focus on the few metrics and touchpoints that shape business growth, including the often-missed signals inside customer chats. For a growing e-commerce brand, that makes analytics less about reporting and more about choosing what to scale, what to fix, and what to stop.
The Four Types of Marketing Analytics Every Marketer Should Know
A simple way to understand analytics is to follow one store owner through a problem.
Leah runs an online skincare shop. Sales feel softer this month. She doesn’t want guesses. She wants answers.
The four types of analytics help her move from “something’s wrong” to “what we’ll do next.”
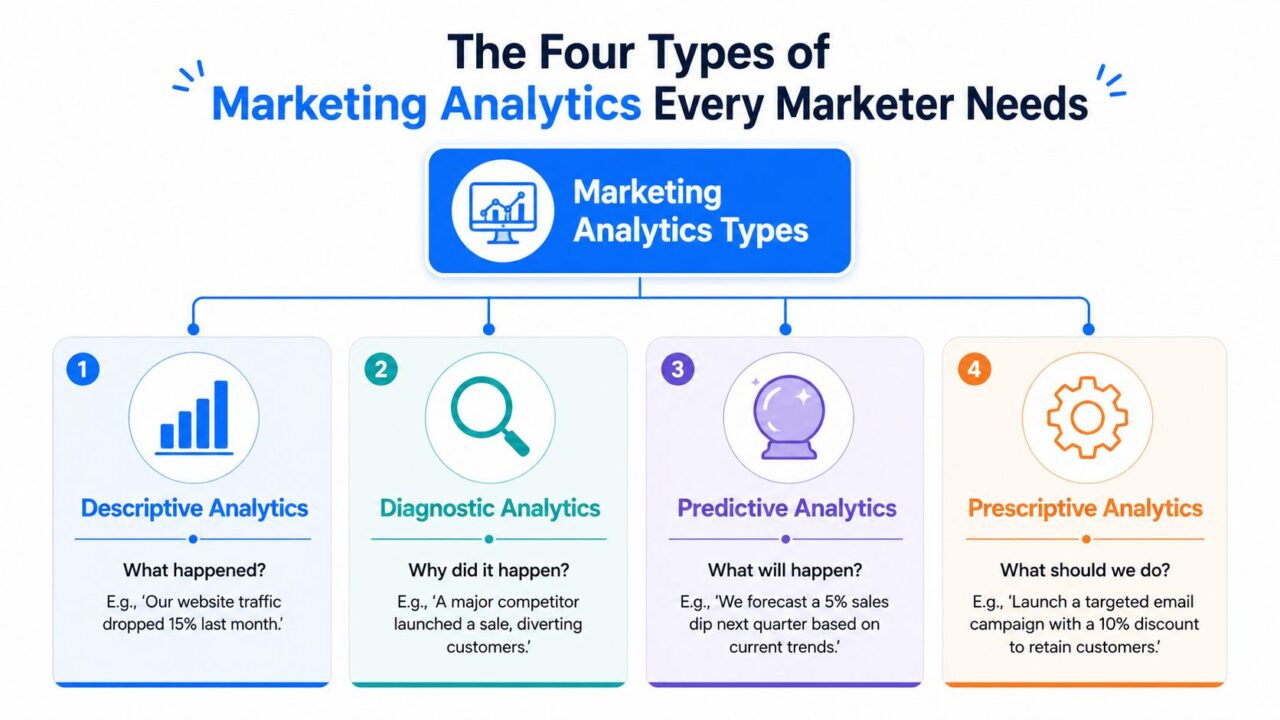
Analytics in Marketing Types
Descriptive analytics tells you what happened
Leah starts with the most basic question. What changed?
She checks her dashboard and sees:
- Traffic patterns: Fewer visitors are reaching product pages.
- Sales trends: Completed purchases are down.
- Channel shifts: One paid campaign is still driving clicks, but not many orders.
Descriptive analytics is the summary layer. It reports what already happened.
If you’ve ever reviewed website sessions, orders, email clicks, or top landing pages, you’ve already used descriptive analytics.
Diagnostic analytics explains why it happened
Knowing that sales dropped isn’t enough. Leah needs the cause.
She digs into behavior reports and finds a likely issue. Visitors are reaching the checkout page but leaving before payment. She tests the site herself and spots friction in the checkout experience.
Diagnostic analytics looks for reasons. It connects symptoms to causes.
Common diagnostic questions include:
- Page friction: Are visitors dropping off at one page?
- Audience mismatch: Did the campaign attract the wrong people?
- Offer weakness: Did the message fail to match buyer intent?
- Technical issues: Is a form, page, or cart step broken?
Key distinction: Descriptive analytics says what happened. Diagnostic analytics tells you where to look for the reason.
Predictive analytics estimates what could happen next
Now Leah asks a forward-looking question. If she fixes the checkout problem, what happens next?
Predictive analytics uses past patterns to forecast likely outcomes. In a practical marketing setting, that could mean anticipating:
- future demand for a product
- likely repeat purchase behavior
- probable performance of a new campaign based on similar launches
For a non-technical team, predictive analytics doesn’t need to be fancy. A simple version is using historical patterns to estimate what might happen if current trends continue.
Prescriptive analytics recommends what to do
Leah has enough evidence to act. She rolls back the problematic checkout change, tests a cleaner layout, and updates messaging for the paid campaign that is still sending traffic.
Prescriptive analytics is the action layer. It answers the question, “What should we do now?”
That recommendation might include:
- pausing low-quality traffic sources
- improving a landing page
- changing the offer
- retargeting a warmer audience
- simplifying the purchase path
The power of this framework is that each type builds on the previous one. First you observe. Then you investigate. Then you forecast. Then you act.
Key Metrics That Actually Drive Business Growth
A small set of metrics usually explains more than a crowded dashboard. For an e-commerce team, the goal is not to collect every number your tools can produce. The goal is to find the few signals that help you decide where to spend, what to fix, and which channels bring in customers who stay.
A good way to judge any metric is simple. Can it help you increase sales, improve customer quality, or strengthen loyalty? If the answer is no, it belongs in the background.
That is why teams often outgrow surface metrics like likes, pageviews, and follower counts. Those numbers can show attention, but attention alone does not pay for inventory, ad spend, or retention campaigns.
What these metrics mean in practice
A useful metric works like a detective’s clue. It does not just describe the scene. It helps you solve the case.
Here are five metrics that often matter most because they connect marketing activity to business results:
- Lead quality and MQLs: Are you attracting people who fit your product and show real buying intent?
- Lead-to-customer conversion rate: Do the people entering your funnel turn into paying customers?
- ROI: Does the revenue influenced by marketing justify the cost?
- Customer acquisition cost: How much are you paying to win one new customer?
- Lead generation volume: Are you creating enough qualified opportunities to keep sales growing?
For e-commerce brands, “lead” does not always mean a form fill. It can also mean an email signup, a quiz completion, a WhatsApp inquiry, a Messenger conversation, or a shopper who starts checkout and asks a product question before buying. That conversational data is easy to ignore because it lives outside standard reports. It often reveals buying intent earlier than a purchase report does.
A useful metric changes behavior. A vanity metric changes mood.
Matching marketing goals to key metrics
| Business Goal | Primary Metric | Example |
|---|---|---|
| Increase profitability | ROI | Compare campaign cost against the revenue it influenced |
| Improve lead quality | Lead quality and MQLs | Review whether leads from one offer are more sales-ready than another |
| Turn more prospects into buyers | Lead to customer conversion rate | Compare how many quiz leads, email leads, or chat leads become customers |
| Lower acquisition costs | Customer acquisition cost | Identify which channel is bringing in customers at a healthier cost |
| Fill the pipeline | Lead generation volume | Measure whether your campaigns are creating enough new opportunities |
This table matters because each row points to a decision. If acquisition cost rises, you may need to cut weak traffic sources or improve your landing page. If lead quality drops, your ad targeting or offer may be attracting the wrong people. If chat leads convert better than email leads, that is a signal to invest more in the channels where customers ask questions before they buy.
Build a small dashboard, not a giant one
A beginner dashboard should feel usable in ten minutes. If it takes an hour to interpret, it will not guide weekly decisions.
Use a simple filter:
- Keep metrics tied to revenue or movement toward revenue
- Keep metrics you can review and act on every week
- Remove metrics that look interesting but never change your next step
Email metrics still have value, but context matters. Open rate can hint at subject line strength or list health, yet it does not prove revenue impact on its own. If you want clearer context before judging email performance, this Practical guide for email open rates explains what open data can and cannot tell you.
Channel credit matters too. A customer might discover you through Instagram, ask a question on WhatsApp, join your email list, then purchase after a retargeting ad. A simple model for marketing attribution basics helps non-technical teams connect those touchpoints without getting buried in complexity.
Pick one North Star
If your team feels buried in reports, choose one primary metric that reflects your main goal right now.
A newer store may focus on customer acquisition cost. A brand with plenty of traffic may focus on conversion rate from lead to customer. A retention-focused business may watch repeat purchase rate or revenue per customer alongside the core metrics above.
Everything else should support that main signal. That is how analytics becomes a practical tool for growth instead of a pile of disconnected numbers.
Your Data Sources and the Tools to Analyze Them
Most businesses don’t have a data shortage. They have a data fragmentation problem.
Your store activity lives in one place. Your ad data lives somewhere else. Email performance is in another platform. Customer conversations are buried in DMs, chat logs, or inboxes. That separation makes marketing look less effective than it really is, or more effective than it really is.
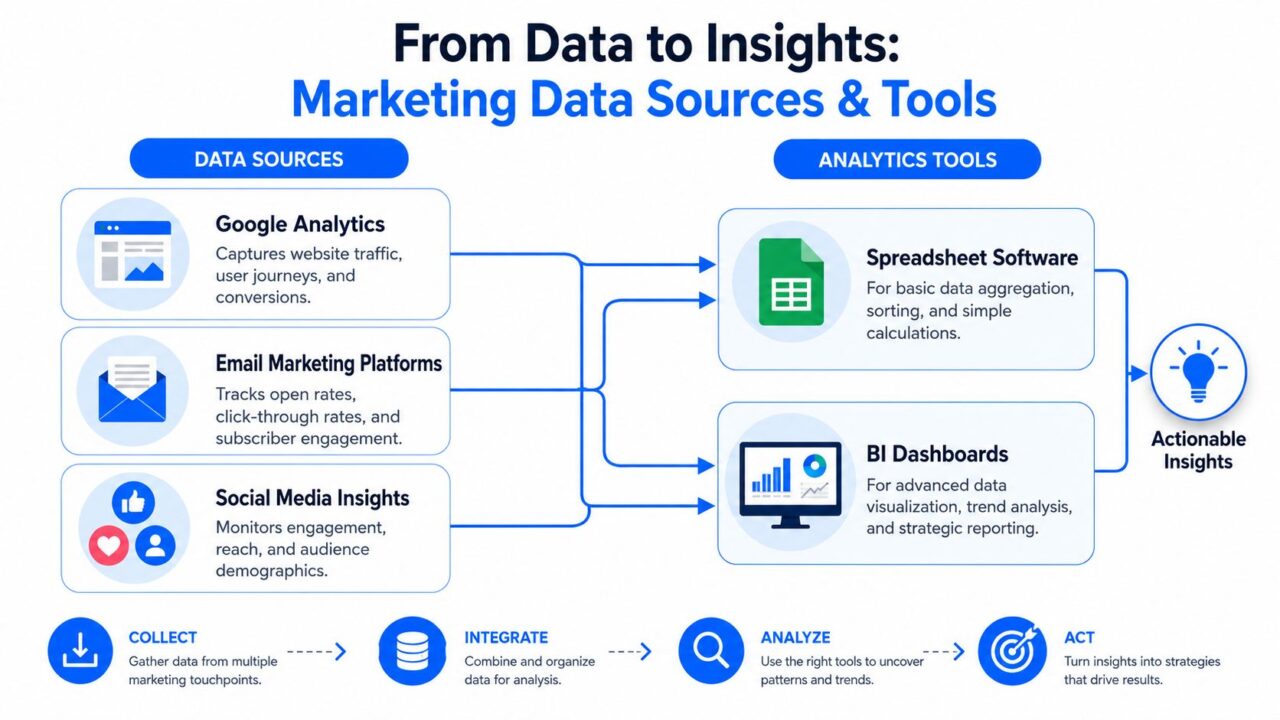
Analytics in Marketing Process
The common data sources most teams already use
A typical non-technical marketing setup pulls information from sources like:
- Website analytics: Google Analytics shows traffic, landing pages, and on-site behavior.
- Email platforms: You can review opens, clicks, unsubscribes, and campaign engagement.
- Social media insights: Platforms report reach, reactions, profile activity, and content engagement.
- Ad managers: Google Ads and Meta Ads show spend, clicks, and campaign performance.
- Store platforms and CRM tools: Shopify or your CRM helps connect marketing activity to orders or lead status.
A spreadsheet can go further than many people think, especially early on. A dashboard tool becomes more useful when you need a clearer visual view of trends across channels.
The conversational analytics gap
At this stage, many analytics setups break.
While 90% of marketers prioritize analytics, existing content still focuses heavily on web and email data, even though WhatsApp, Messenger, and Instagram account for where 60% of global e-commerce discovery now occurs, according to this analysis of the marketing analytics gap.
That matters because conversation data often contains strong buying signals:
- product questions
- shipping objections
- coupon requests
- sizing concerns
- abandoned cart replies
- repeat customer intent
If you only measure the website and ignore the conversation that pushed the person to buy, your attribution stays incomplete.
Conversations are not side activity. For many brands, they’re part of the funnel.
Choosing tools without overcomplicating your stack
The right tool depends on what question you’re trying to answer.
A simple way to categorize tools:
| Tool category | Best for | Example use |
|---|---|---|
| Foundational analytics | Basic traffic and conversion tracking | Review which landing pages lead to purchases |
| Messaging and email tools | Campaign response tracking | Compare subject lines, clicks, and follow-up behavior |
| Dashboards and spreadsheets | Trend spotting and reporting | Pull channel data into one weekly review |
| Visitor and behavior tracking tools | Journey analysis | See where users arrive, browse, and leave |
If you’re trying to understand visitor behavior before someone converts, this guide to tracking website visitors more effectively adds useful context.
The practical takeaway is simple. If your buyers move between ads, email, website visits, and direct conversations, your analytics should reflect that journey. Otherwise, your reporting will keep undervaluing the channels that are doing some of the hardest persuasion work.
Putting Analytics into Action with Real World Use Cases
Theory becomes useful when you can see how a team would act on the numbers.
The examples below show three different ways marketing analytics helps people make better decisions. Each one starts with a business question, not a dashboard.
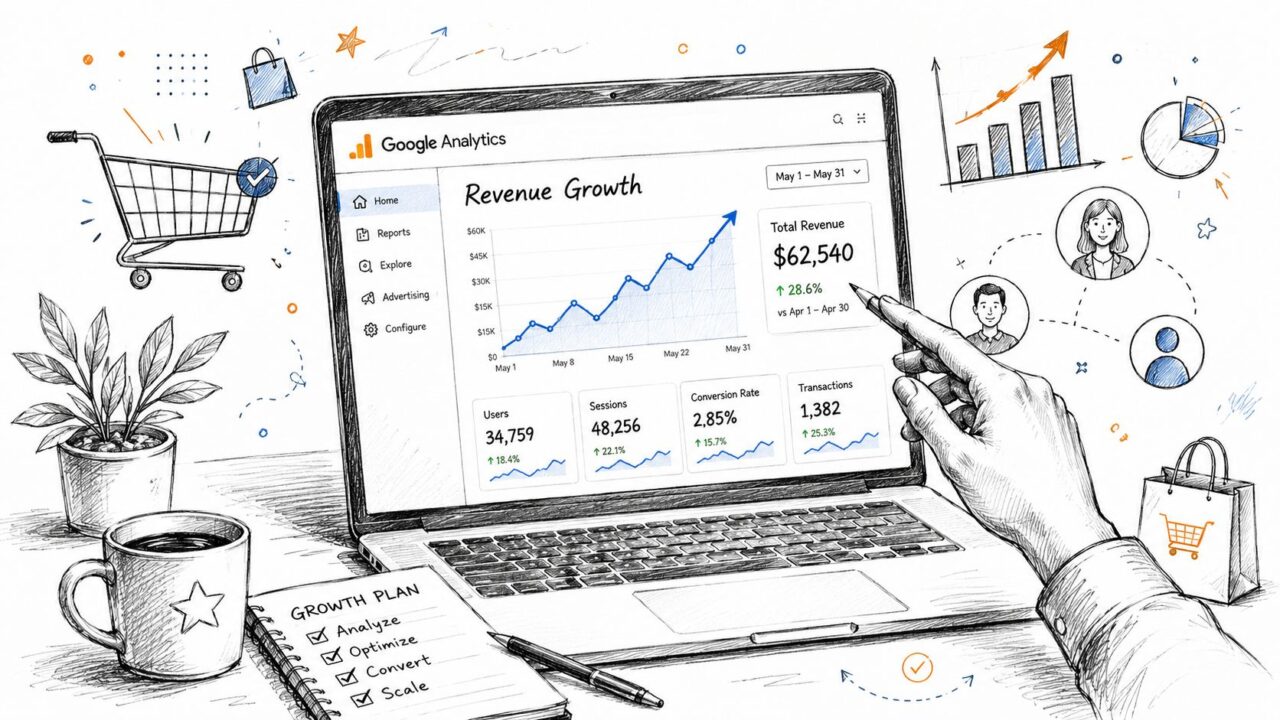
Analytics in Marketing Google Analytics
An e-commerce brand reallocates ad spend
An online apparel store is running search ads, paid social, and email campaigns for a seasonal promotion. Traffic looks healthy, but profit feels tight.
The team reviews:
- landing page behavior in Google Analytics
- conversion paths from each campaign
- campaign cost compared with resulting sales
They find that one paid social campaign creates lots of sessions but weak purchase intent. Search traffic converts better. Email produces fewer visits, but those visitors buy at a stronger rate.
So they act:
- reduce spend on low-intent traffic
- keep funding the higher-converting channel
- adjust social creative to pre-qualify clicks better
This is analytics doing its real job. It isn’t admiring data. It’s moving budget toward better outcomes.
A SaaS company fixes onboarding drop-off
A subscription software company notices that trial sign-ups are fine, but too many users disappear before reaching activation.
The team studies the onboarding funnel and spots a drop-off after one key setup step. New users seem interested, then stall.
They respond by:
- simplifying the setup sequence
- rewriting the in-app guidance
- sending a better-timed follow-up email
- testing a clearer call to action
The key lesson is broader than SaaS. Funnel analysis helps any business locate friction. In e-commerce, that friction might be shipping confusion, a cluttered cart, or a weak product explanation. In software, it might be setup complexity.
A coach improves lead qualification through conversation data
A business coach runs webinars, email sequences, and direct outreach through social messaging. Website forms bring in leads, but not all leads are equal. Some people are curious. Others are ready to buy.
The coach starts reviewing conversational patterns:
- which broadcast messages get the strongest click-through responses
- which phrases in replies suggest urgency or intent
- which follow-ups lead to booked calls
- which abandoned conversations never re-engage
That creates a smarter process.
Warm leads can be tagged based on buying signals. Follow-up messages can change based on what a person asked. A cart recovery or booking reminder can be measured against actual outcomes instead of guessed at.
If you’re trying to improve this stage of the funnel, these conversion rate optimization techniques can help you think more clearly about where messaging, timing, and friction affect results.
The best use cases start with a narrow question. Why are people dropping off here? Which message creates intent? Which source brings buyers, not browsers?
Across all three examples, the pattern is the same. Collect signal. Find friction. Make one decision. Measure again.
Your Simple Plan to Get Started with Marketing Analytics
Analytics is often made harder than it needs to be. It typically involves trying to measure everything, connect every tool, and build the perfect dashboard before a single business question has been answered.
Start smaller.
A beginner plan that works
-
Choose one goal
Pick the business result that matters most right now. More sales. Better leads. Lower acquisition cost. More repeat purchases.
-
Track two or three metrics
If your goal is sales, you might watch conversion rate, ROI, and customer acquisition cost. If your goal is lead quality, you might watch lead quality, conversion to customer, and lead volume.
-
Use one tool first
Start with the platform that already holds the clearest signal. That may be Google Analytics, Shopify reports, your email platform, or a simple spreadsheet.
Best practices that keep analytics useful
A few habits make a huge difference:
- Focus on actionable metrics: Track numbers that support a real decision.
- Use simple attribution: Even a basic first-touch or last-touch view is better than no attribution at all.
- Review consistently: A smaller weekly review beats a giant quarterly scramble.
- Add context before reacting: A spike or drop only matters when you know what caused it.
- Respect privacy: Make sure your tracking and customer data practices align with rules like GDPR and with customer expectations.
Start before your setup feels complete. Clarity usually comes from reviewing real data, not from designing a perfect dashboard in advance.
If you’re still asking what analytics in marketing is, the simplest answer is this. It’s the practice of using evidence from your marketing activity to make better business decisions. Not more complicated decisions. Better ones.
The teams that get value from analytics aren’t always the most technical. They’re the most consistent. They choose a goal, measure what matters, and act on what they learn.
If you want a simpler way to connect website activity, direct conversations, segmentation, and no-code automation in one place, Clepher is built for that job. It helps businesses turn Messenger, WhatsApp, Instagram, and on-site chats into measurable marketing actions so you can qualify leads, recover sales, personalize follow-up, and make analytics more useful without needing a technical team.

Related Posts
Customer Journey Automation: The Practical Guide
October 10, 2026Lead Qualification Marketing: A Practical 2026 Guide
October 9, 2026Customer Experience Optimization Playbook
October 8, 2026
Founder Clepher