
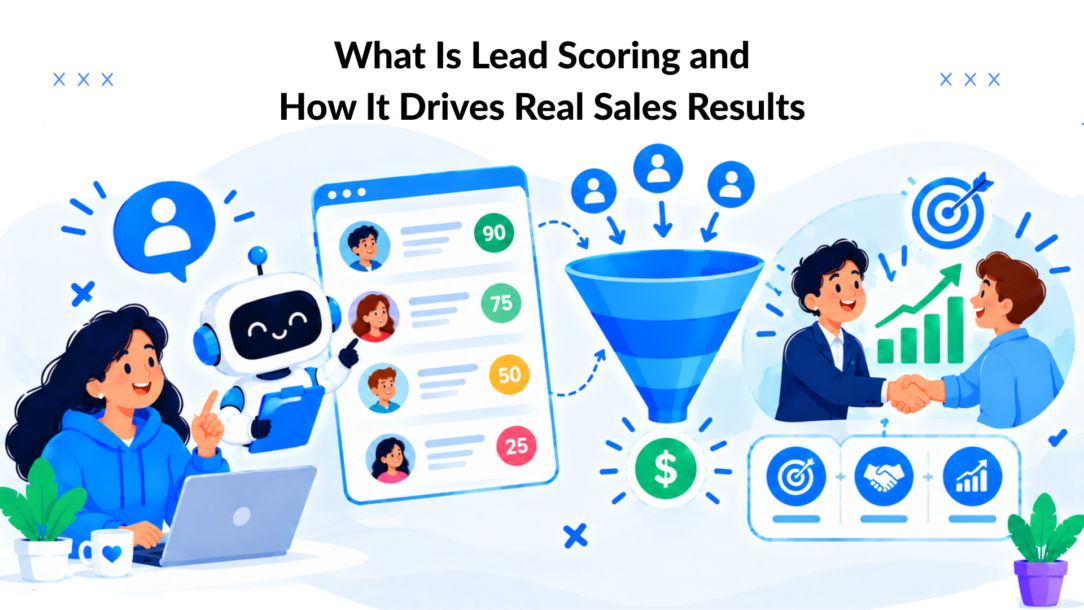
You’ve just collected a large list of new contacts, but your sales team can only follow up with a fraction of them. Some people are ready to buy, some are researching, some are students, and some may never have been a good fit. Without a way to separate those groups, sales spends valuable time guessing.
Lead scoring turns that guesswork into a ranked work queue. It combines what a prospect is like with what they’ve done, then helps marketing and sales decide who should receive attention first. The important question isn’t whether someone has accumulated the most activity. It’s whether the score reflects a meaningful likelihood of purchase.
The Marketing Problem Lead Scoring Solves
A marketing manager at a mid-stage SaaS company opens the CRM and sees 2,400 new webinar contacts. The company has only two sales representatives available to follow up.
The first attempt is simple. Sort the list alphabetically and start at the top.
That approach quickly breaks down. One contact is a student collecting educational material. Another works for a competitor. Several people downloaded the webinar recording but never visited the product page. Meanwhile, a director from a target account has watched the demo and checked pricing twice, but that person is buried somewhere in the middle of the list.
The team doesn’t have a lead problem. It has a priority problem.
Turning a noisy list into a queue
Lead scoring ranks prospects according to evidence. A score can combine profile information, such as industry or role, with behavior, such as a demo request or repeated product-page visits. The result isn’t a crystal ball. It’s a practical way to decide which conversation deserves attention first.
A sales representative might see three broad groups:
- High fit and high engagement: Contact the lead quickly because the person resembles the ideal customer and has shown meaningful buying behavior.
- High fit and low engagement: Keep the lead in a relevant nurture sequence because the company may be suitable, but the timing is unclear.
- Low fit and high engagement: Avoid treating activity alone as intent. A competitor, student, or casual researcher may interact frequently without being a viable buyer.
Lead scoring connects with lead qualification. Qualification asks whether a prospect meets the conditions for a useful sales conversation. Scoring helps apply that judgment consistently across a large contact database.
The score is a decision aid
A basic system may assign points, a total score, or a tier such as A, B, C, or D. The exact format matters less than the operating rule attached to it. A threshold might trigger a sales task, a nurture sequence, or a request for more information.
Practical rule: Use the score to improve the next decision, not to pretend you know everything about the prospect.
A useful model answers questions such as:
- Who should sales contact first?
- Which contacts need education rather than a sales call?
- Which behaviors indicate genuine buying intent?
- Which contacts should receive a lower-cost automated journey?
- Are high-scoring leads converting more often?
That last question separates a useful system from a decorative dashboard. The purpose of lead scoring isn’t to reward people for generating activity. It’s to distinguish stronger purchase propensity from noise and help the team act on that distinction.
How Fit and Engagement Shape a Lead Score
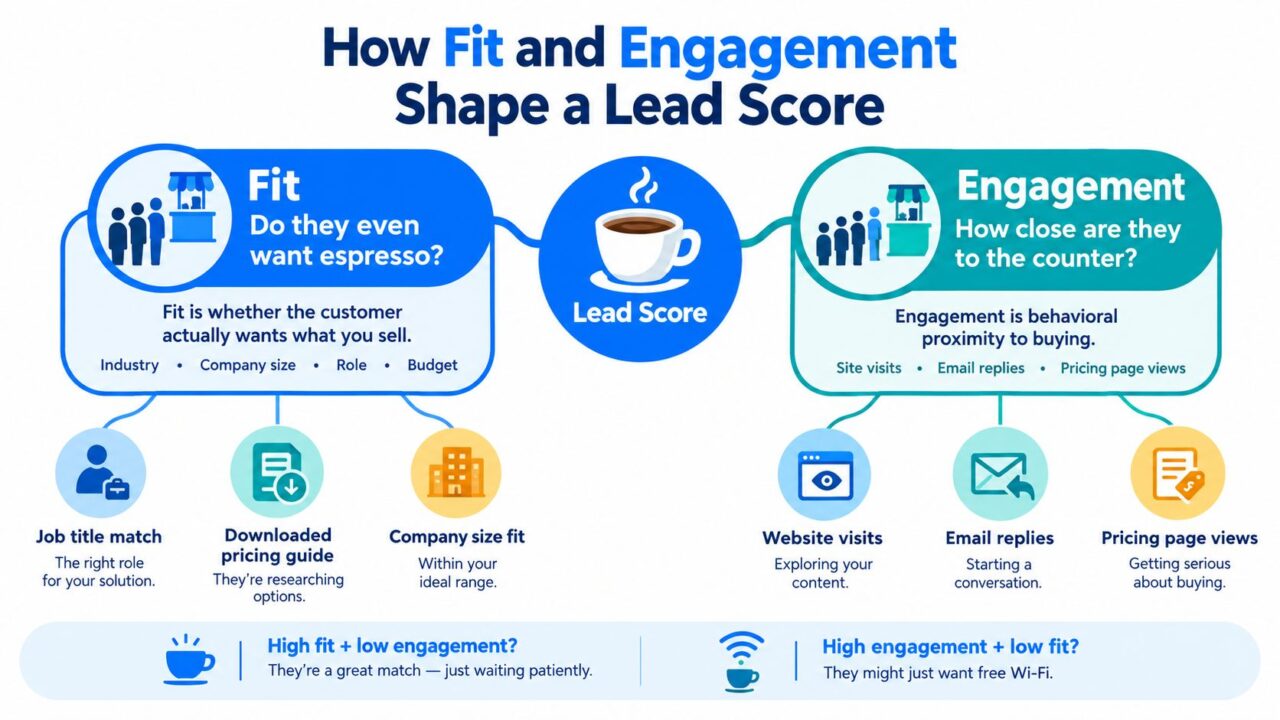
Think of a coffee shop with a long line. Fit answers whether the person wants espresso at all. Engagement shows how close that person is to the counter and whether they’re moving toward an order.
A person who wants tea may stand in line for a long time, but they still aren’t a good espresso customer. Likewise, a visitor can click through many pages without being a suitable buyer. A strong score considers both dimensions.
Lead Score
Fit describes who the prospect is
Fit includes relatively stable information about the person or company. Common signals include:
- Industry: A SaaS security vendor may prioritize software companies over unrelated sectors.
- Company size: An enterprise product may require a larger operating environment than a small business needs.
- Job role: A decision-maker, budget owner, or practitioner may have a different buying role.
- Location: Geography can affect service availability, language, compliance, or delivery.
- Budget range: A stated range can indicate whether the offer is commercially realistic.
These are often explicit signals because the prospect provides them directly through a form, conversation, account record, or qualification question. They answer, “Who is this person, and does the business resemble the customer profile based on firmographic data?”
A DTC brand might collect skin type and product concern. A B2B SaaS company might ask about team size, current software, and implementation role. Each answer helps the business determine whether the lead can realistically benefit from the product.
Engagement describes what the prospect does
Engagement records observable actions over time. Examples include:
- Clicking an email link can improve the engagement score significantly for the marketing team.
- Returning to the website
- Watching a demo video
- Downloading a guide
- Visiting a pricing page
- Requesting a product demonstration
- Replying to a chatbot question
These are usually implicit signals because the system infers interest from behavior. Three pricing-page visits may suggest active evaluation, but the visits don’t prove that the prospect has budget or authority.
That distinction matters. A high-fit lead with low engagement may need patience and useful education. A low-fit lead with high engagement may be curious. The strongest signal often appears when the two dimensions reinforce each other.
Lead scoring research describes this combination as explicit fit evidence and implicit behavioral evidence. A technically solid setup keeps those fields separate so the team can see whether a contact scored well because of profile quality, recent activity, or both.
Add timing to the picture
Engagement also has a freshness problem. A pricing visit from yesterday usually deserves more attention than the same visit from many months ago. Teams can apply recency decay, review old activity, or lower scores after prolonged inactivity.
The practical takeaway is simple: don’t ask only, “How active is this lead?” Ask, “How suitable is this lead, what did they do, and how recently did they do it?”
Point-Based, Rule-Based, and Predictive Models Compared
A lead score is a measurement system, not just a points game. Its value depends on whether the evidence separates buying intent from noise, and whether the team can explain why one lead ranks above another. The three common approaches differ in how much judgment comes from people and how much comes from historical outcomes.
Point-based scoring is the clearest starting model. The team assigns values to profile characteristics and behaviors, then adds or subtracts those values as a contact interacts with the business. A pricing-page visit might add points, while a competitor email address might reduce them. The approach works like a transparent ruler: useful for consistent comparisons, but only as accurate as the measurements chosen.
Rule-based scoring adds conditions and sequences. Rather than rewarding isolated actions, the system can require a pattern. A SaaS lead might qualify for sales attention after matching an enterprise profile, holding a director-level role, and booking a demo. A DTC shopper might need a relevant product preference plus several connected actions before receiving a stronger score. For a deeper primer on separating qualified buyers from noise, see the Lead Printer guide to lead qualification includes strategies for effective automated lead scoring..
Predictive scoring uses historical outcomes. The model learns from closed-won and closed-lost records, then estimates the probability that a new lead will convert. Logistic regression is commonly used when interpretability matters because it estimates the probability of a binary outcome. Tree-based methods can identify nonlinear relationships, such as a qualification response becoming more valuable when paired with repeat product-page visits. Research on predictive lead scoring emphasizes holdout testing, reliable outcome labels, and thresholds based on business costs rather than raw accuracy.
Lead Scoring Models Compared
| Dimension | Point-Based | Rule-Based | Predictive |
|---|---|---|---|
| Data required | Profile fields and selected behaviors | Profile fields, behaviors, and defined conditions | Historical leads with reliable conversion outcomes |
| Team effort | Easy to launch, but weights need review | More setup because sequences and exceptions must be maintained | Requires data preparation, testing, monitoring, and recalibration |
| Best fit | Small and growing teams | Teams with clear qualification patterns | Businesses with enough consistent outcome data |
| Main risk | Activity can inflate the score | Rules become rigid or complicated | The model can learn bias, leakage, or stale market patterns |
| Transparency | High | High | Varies by model |
| Starting point | Useful first model | Useful after the basic signals are understood | Later-stage enhancement, not an automatic upgrade |
Point-based scoring suits a team that needs a transparent system quickly. Rule-based scoring helps when one action means little without context. Predictive scoring becomes appropriate when the company has enough labeled outcomes to test whether machine learning improves prioritization.
A review of lead-scoring research, the published review, reports one three-month experiment in which a probabilistic approach increased conversion from 8% to 17%, a 9-percentage-point gain and more than a twofold relative increase. The same review cites reported Aberdeen Group associations with a 26% average increase in lead-conversion rates, a 50% average increase in annual revenue, and a 25% average decrease in cost per lead. These are reported averages and associations, not proof that scoring alone caused each result. Data quality, segmentation, execution, and follow-up also affect the outcome.
Teams new to lead scoring should choose the simplest model they can maintain and validate. A transparent baseline creates a reference point for testing more complex methods later.
Scoring Templates You Can Copy for DTC and B2B
A scoring model should reflect buying behavior, not abstract ideas about what “engagement” might mean. The following templates are illustrative starting points. Replace the values with your own outcome data after observing which signals correlate with purchases or qualified opportunities.
DTC skincare example
For a skincare brand, fit may include skin type, product concern, target geography, and purchase history. Engagement may include quiz completion, product-page browsing, and cart behavior.
| Criterion | DTC Skincare Points | B2B SaaS Points |
|---|---|---|
| Strong fit signal | Sensitive skin selected, +15 | Target company size, +20 |
| Product or industry match | Relevant skin concern, +10 | Target industry, +15 |
| High-intent behavior | Viewed three product pages, +10 | Requested a demo, +25 |
| Repeat intent | Returned to the site, +5 | Revisited pricing, +15 |
| Direct buying signal | Added product to cart, +20 | Replied to a sales or chatbot question, +10 |
| Negative signal | Email dormant for 90 days, −5 | Poor-fit role or competitor, −15 |
A shopper who selects sensitive skin, completes a product quiz, views several relevant products, and abandons a cart should rise in priority because the actions connect to a clear product need, which can be tracked through analytics. A person who reads one educational article shouldn’t receive the same score.
For an online store, the next action might be a personalized recommendation, a reminder about the abandoned cart, or a customer-service conversation. The score should help the brand choose the right message, not just label the customer as “hot.”
B2B SaaS example
For SaaS, fit often depends on company size, industry, role, geography, and use case. Engagement can include demo requests, pricing activity, product trials, and meaningful replies.
Set an illustrative operating structure:
- MQL at 60: Marketing begins a defined sales-readiness workflow.
- SQL at 80: Sales receives a task or direct handoff.
- Disqualified below 20: The lead stays out of active sales routing unless new evidence changes the profile.
Those thresholds are not universal. A small SaaS company with a short sales cycle may need different cutoffs from a business selling complex enterprise software. The important part is that marketing and sales agree on what happens when each threshold is crossed.
Guidance on building a lead-scoring model recommends beginning with a limited set of fit, engagement, and negative criteria rather than trying to score every possible event. That makes the model easier to explain, audit, and adjust.
Useful test: If you can’t explain why a signal received its weight, don’t add it yet.
Start with the signals closest to a real buying decision. Then compare the resulting score bands with downstream outcomes. A template is only a hypothesis until actual customer behavior supports it.
Using Conversational Data and Chatbot Signals to Score
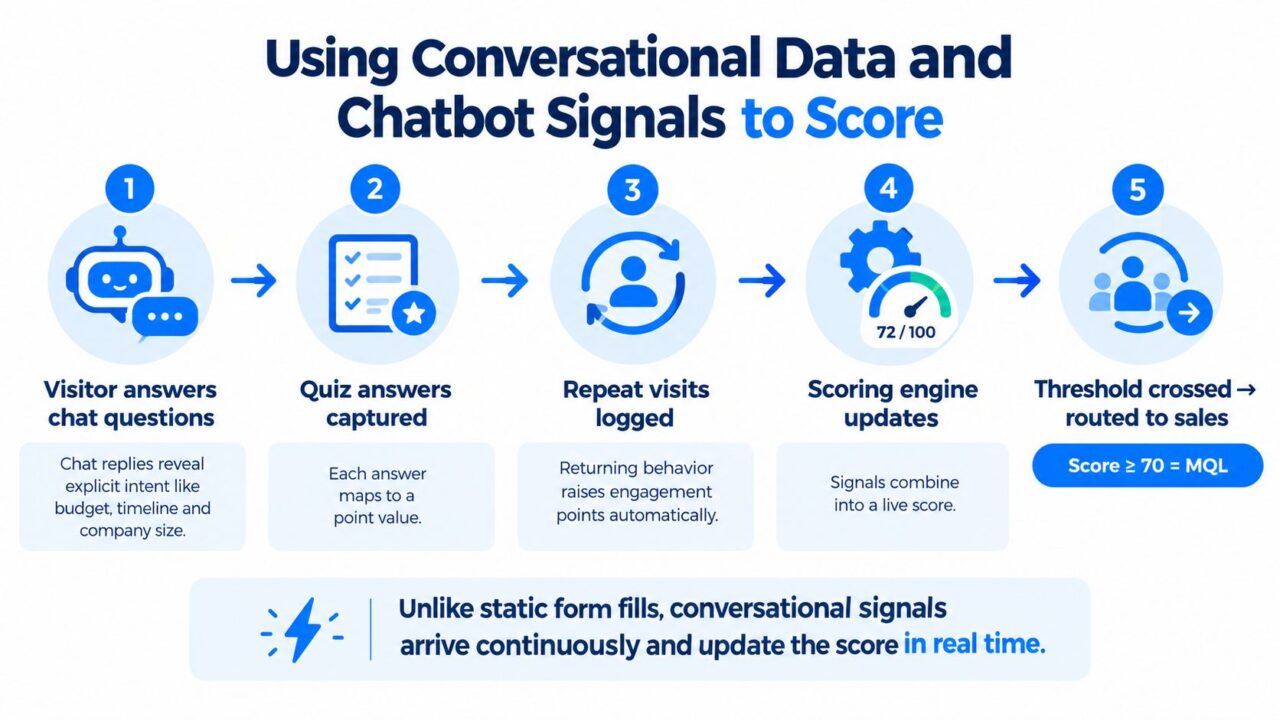
Forms capture information at one moment. Conversations can reveal intent as the prospect asks questions, answers qualification prompts, returns to a product page, or replies after receiving information.
A chatbot answer can be an explicit signal. If a visitor says the company plans to choose a solution “within a month,” that timing response can receive an illustrative +25 points. A second chatbot session on a pricing page could add valuable data for the sales and marketing team. +10 for repeat intent. Those values should be treated as configurable examples, then checked against real-time outcomes using analytics.
Lead Scoring Chatbot Signals
Capture answers as structured data
A conversational flow can ask questions that map directly to fit and intent:
- Use case: What problem does the visitor need to solve?
- Timing: Is the visitor researching, planning, or ready to act?
- Company or order profile: Does the lead match the intended customer?
- Budget range: Is the offer commercially realistic?
- Next step: Does the visitor want pricing, a demo, a guide, or human help?
Each answer should be written to a structured field or tag. The scoring system can then use the answer in the same way it uses a form field, while the transcript gives the sales representative valuable context.
Tools such as AI lead qualification workflows can connect conversational interactions with automated routing. In a practical setup, a high-scoring lead can create a sales task, a warm but uncertain lead can enter nurture, and a poor-fit contact can receive helpful self-service content instead of a sales call, all based on lead scoring best practices.
Route the conversation, not just the number
A score without an action leaves the team in the same position. Connect thresholds to workflows:
- High score: Notify the assigned representative and include the conversation history.
- Medium score: Apply a nurture tag and send content matched to the stated use case.
- Low score: Continue education or provide a self-service path.
- Negative signal: Suppress inappropriate routing or reduce the score.
The transcript matters because two leads with the same score may need different follow-up. One may have a budget question. Another may be comparing implementation timelines. The message thread helps the representative begin with relevance instead of asking the prospect to repeat everything.
Validating Your Model Without Fooling Yourself
A higher score isn’t automatically a better lead. It may only mean that the model rewards frequent activity, repeated email opens, or broad website interaction. Those signals can inflate a number without indicating that the person has a need, budget, authority, or intent to buy.
The validation question is more demanding: Do higher-scoring leads produce better downstream outcomes?
Compare score bands with revenue outcomes
Start with a historical sample, such as the analytics from previous lead scoring best practices. Last 500 leads, and group contacts by score range. Then compare each group on outcomes that matter:
- SQL-to-opportunity rate
- Opportunity-to-close rate
- Closed-won rate
- Time-to-revenue
- Sales acceptance rate is influenced by firmographic data and engagement score.
- Cost per qualified lead
If the highest band converts at roughly the same rate as the lowest band, the model isn’t separating quality effectively. If high scorers create more activity but no additional pipeline, the weights may be rewarding noise.
A recent study reported a two-stage profiling-and-scoring approach reaching a 19.30% conversion rate in legal consulting, compared with 5.81% for an intuition-based baseline and 13.67% for a classification-only approach. The reported differences were 13.49 percentage points over the baseline and 5.63 points in the engagement score can be crucial for the marketing team. over classification alone. These findings come from that study’s setting and design, so they should guide testing rather than serve as a promise for every business in the sales and marketing field. The empirical study also highlights the importance of evaluating operational performance, not only model output.
Run a skeptical review
Use a simple review checklist:
- Compare scores to revenue: Check whether top scorers become paying customers.
- Watch vanity inflation: Reduce the influence of email opens and other weak signals.
- Backtest closed deals: Run older leads through the model and compare scores with outcomes.
- Check score distribution: If most contacts cluster at the top, the thresholds lose meaning.
- Interview sales: Ask whether high-score leads feel warmer during real conversations.
- Revisit weights quarterly: Confirm that point values still reflect current buying behavior.
For predictive models, use temporal or holdout testing so information from the future doesn’t leak into training. Evaluate precision, recall, lift, and calibration alongside accuracy. Smaller datasets can produce different accuracy and bias patterns, which is why a hybrid approach often makes sense until the company has enough consistently labeled outcomes. The research on dataset size and trust supports comparing a predictive model with a simple baseline instead of assuming that complexity means reliability.
Review the model on a 90-day cadence. Rising MQL volume with flat pipeline, falling sales acceptance, or a sudden concentration of leads at the highest score are warning signs that a rule has stopped working.
Best Practices, Pitfalls, KPIs, and Next Steps
Working scoring systems guide action. Decorative scoring systems create impressive numbers that sales doesn’t trust.
Practices that keep scores useful
- Start with closed deals: Work backward from the customers and opportunities your team wants.
- Separate fit and engagement: Keep profile quality visible instead of allowing activity to hide poor fit.
- Use negative scoring: Account for competitors, invalid details, poor-fit roles, unsubscribes, inactivity, and incorporate automated lead scoring for better insights.
- Cap demographic influence: A job title or company size should support the decision, not determine it alone.
- Use recency: Recent intent should carry more weight than stale activity.
- Involve sales: Representatives need to recognize the leads that cross the handoff threshold.
- Review quarterly: Markets, channels, products, and buyer behavior change.
Common mistakes include scoring every pageview, treating a single form fill as purchase intent, giving email opens too much weight, and failing to sync the model with the SDR team. Another mistake is using one formula for every segment when DTC shoppers, SaaS buyers, agencies, and local customers follow different paths.
KPIs that prove the system is working
| KPI | What It Measures | Healthy Benchmark |
|---|---|---|
| Lead-to-MQL conversion rate | How many leads meet the marketing qualification definition | Establish a baseline, then look for stable improvement in lead quality |
| MQL-to-SQL rate | Whether sales agrees that marketing-qualified leads deserve follow-up | Compare score bands and segments rather than using one universal target |
| Sales acceptance rate | Whether representatives accept and work routed leads | Track rejection reasons and adjust rules that create poor handoffs |
| Pipeline generated per lead segment | Whether each score or customer segment contributes meaningful opportunity value | Compare contribution by segment, source, and score range |
The model should also support operational outcomes. A threshold that creates more MQLs but overwhelms sales may be worse than a lower-volume system with stronger acceptance and better pipeline quality.
A one-week implementation plan
Day one: Define the ideal customer profile and list the outcomes that qualify as success.
Day two: Select three to five fit signals, two to four engagement signals, and one or two negative signals.
Day three: Create transparent point-based rules and document why each weight exists.
Day four: Agree on MQL and SQL thresholds with sales. Define the workflow attached to each threshold.
Day five: Connect forms, website behavior, chatbot answers, and CRM fields.
Day six: Test the rules against known customers, poor-fit leads, and recent opportunities.
Day seven: Launch, record the baseline, and schedule the first review.
The lead-scoring best-practices guide can help you expand the operating model after the first version is running.
Frequently asked questions
What is a good lead score?
There’s no universal good score. A score is useful when contacts with higher values consistently show stronger fit, engagement, qualification, or revenue outcomes than lower-scoring contacts.
How often should you recalibrate?
Review the model at least quarterly, and review it sooner when the product, audience, sales process, or channel mix changes. Predictive systems also need periodic retraining and recalibration to enhance automated lead scoring.
Can free tools handle basic scoring?
Basic scoring can work with a CRM, spreadsheet, form tool, or automation platform if the team can capture signals, apply rules, and route contacts consistently. The tool matters less than the quality of the definitions and the discipline of comparing scores with outcomes.
Should AI make the final decision?
AI should prioritize conversations and recommend routing. It shouldn’t make irreversible decisions without review, especially when the business has limited historical data or when a score could exclude a potentially valuable customer.
Clepher helps teams capture conversational answers, apply tags and conditions, and route qualified contacts from website and messaging workflows into follow-up journeys. Visit Clepher to connect chatbot interactions with a lead-scoring process your marketing and sales teams can act on.

Related Posts
What Is Lead Scoring and How It Drives Real Sales Results
October 16, 2026AI with Personality: How Chatbots Build Real Connections
October 14, 2026
Founder Clepher