A credible automation ROI calculation separates measurable benefits from the full investment required to create them. For example, a $120,000 implementation with $75,000 in annual gross benefits and $15,000 in recurring costs produces a 50% first-year ROI and a 24-month simple payback.
The popular advice says to multiply hours saved by an employee’s hourly cost and call the result financial return. That shortcut is often wrong. Recovered time only becomes cash savings when you reduce payroll or overtime, avoid planned hiring, or convert the capacity into attributable revenue. A useful model must show not only whether automation works, but when its operational gains become financial results.
Why Most Automation ROI Calculations Get It Wrong
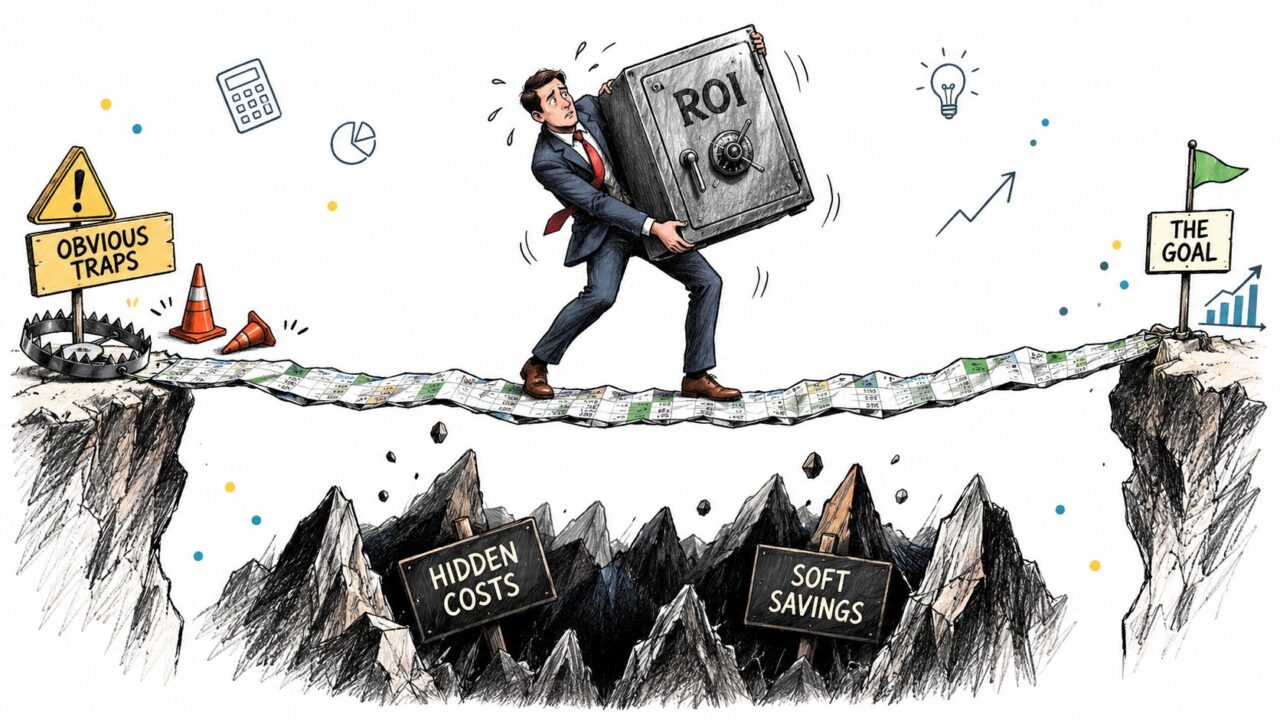
Time saved isn’t the same as money earned. A support team can handle conversations faster, a marketer can launch campaigns with less manual work, and a sales team can qualify more leads without adding staff. None of those improvements automatically creates profit.
The gap becomes obvious in the available evidence. Roughly 80% of surveyed firms reported no realized impact on productivity, output, or employment over a three-year period, despite forecasting gains in the following three years, according to evidence on AI automation outcomes. That doesn’t mean the automation failed. It may have created capacity that the business never used.
Automation ROI Calculation Business Risk
The difference between efficiency and return
A team that saves labor hours has created capacity value. That value becomes financial return only when someone makes a deliberate business decision about it.
- Cash savings result from lower payroll, fewer overtime hours, reduced agency spend, or lower support costs.
- Avoided costs come from preventing planned hiring, avoiding extra software or service capacity, or reducing errors that would otherwise create expense.
- Incremental revenue comes from attributable purchases, qualified leads that convert, retained customers, or improved conversion paths.
- Capacity value reflects work the existing team can now complete, but it shouldn’t be counted as cash unless that capacity produces measurable business output.
Only about 37% of organizations said AI’s impact appeared in profits, while just 6% reported significant value representing at least 5% of operating profit, as reported in the same evidence. Those figures point to a measurement problem, not a technology problem.
Practical rule: Never put “hours saved” directly into the benefit column until you can explain what the business does with those hours.
A conversational workflow illustrates the issue. If an automated Messenger flow answers routine questions, the support team may spend less time on repetitive contacts. If demand stays flat and staffing stays unchanged, the immediate financial benefit may be limited. If the team handles more customers without hiring, or the saved capacity produces more sales conversations, the return becomes easier to defend.
That distinction protects leadership from inflated business cases. Operational success matters, but a sound automation ROI calculation must connect the workflow to cash savings, avoided costs, incremental revenue, or capacity that the business can deploy.
Defining Measurable Goals and Establishing Your Baseline
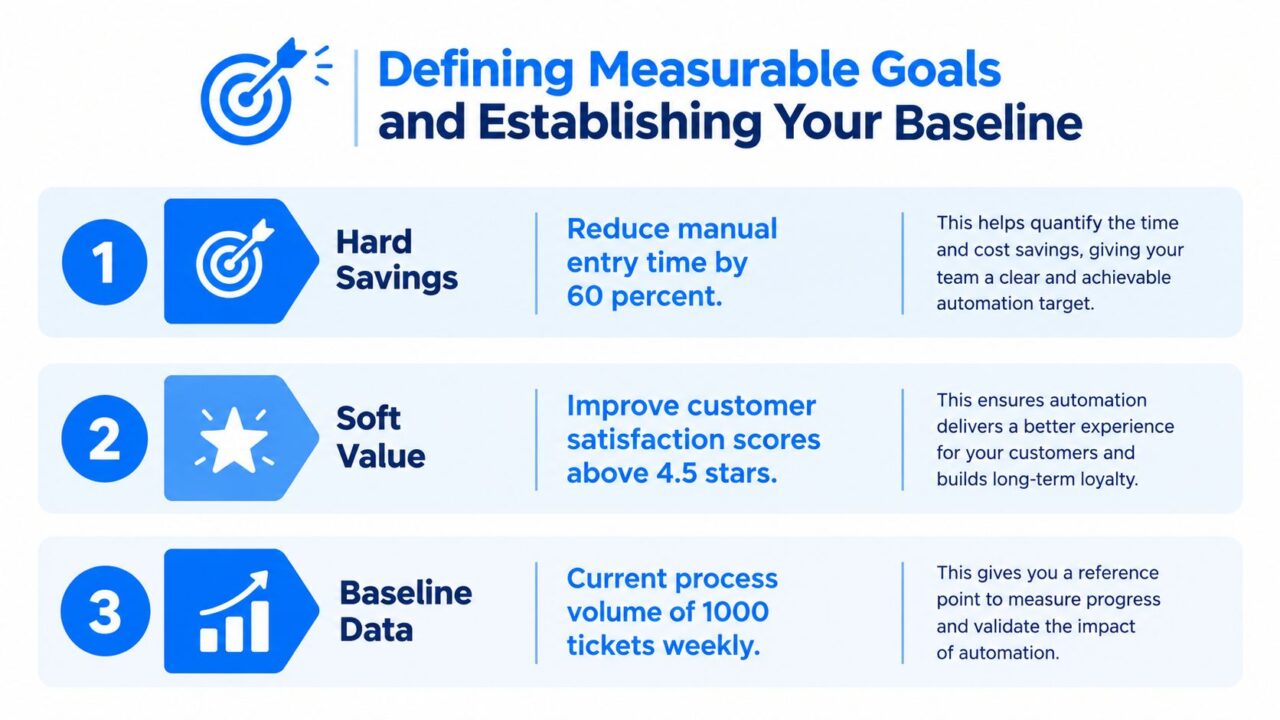
Start with the business decision, not the platform. “Automate customer conversations” is an activity. “Reduce avoidable support work while preserving customer satisfaction” is a measurable objective that can feed a financial model.
Write the target in a way that identifies the process, the expected business effect, and the measurement period. For an e-commerce brand, the target might involve recovered purchases or qualified leads. For a SaaS company, it might involve fewer repetitive support contacts or more trial users progressing toward paid plans. For an agency, it might involve reducing manual campaign operations without weakening client reporting.
Automation ROI Calculation Measurable Results
Build the baseline from operating data
A baseline should describe what happens today, not what the team hopes will happen after implementation. Pull the information from the systems already handling the work:
- Revenue baseline: Record attributable purchases, qualified leads, revenue per qualified lead, and the existing conversion path.
- Cost baseline: Capture support cost per contact, agency or staffing expense, platform charges, and the internal labor involved in the current process.
- Efficiency baseline: Measure response time, contact volume, manual handling time, escalation frequency, and the amount of work completed by each role.
- Quality baseline: Track errors, failed handoffs, incomplete lead records, repeat contacts, and customer complaints connected to the workflow.
Don’t blend all metrics into one optimistic forecast. Keep operational measures separate from financial measures. A lower response time is useful evidence of process improvement, but it isn’t revenue until a controlled comparison shows that faster handling produces more attributable conversions or reduces a real cost.
Set an attribution method before launch
Choose how you’ll distinguish automation impact from seasonality, promotions, traffic changes, staffing shifts, and product changes. A controlled holdout, randomized path test, or carefully adjusted pre-and-post comparison can provide a stronger basis than a simple before-and-after snapshot.
Create a baseline worksheet with four columns: current value, source system, target movement, and financial translation. The final column forces a hard question. If the process improves, which line in the profit-and-loss statement changes?
A baseline isn’t a prediction. It’s the reference point that keeps the calculation honest.
Identifying All Costs and Quantifying Benefits
The denominator usually fails before the numerator does. Teams often count the subscription and implementation invoice, then ignore the work required to make the automation reliable in production.
A complete model should separate one-time investment from recurring operating costs. One-time investment can include software or equipment, implementation, integration, data cleanup, conversation design, training, process redesign, and internal project labor. Recurring costs can include platform fees, messaging charges, maintenance, monitoring, content updates, human oversight, and support for failed or low-quality interactions.
For conversational marketing, creative work deserves its own line. Someone must map intents, write messages, define qualification rules, create handoff paths, test edge cases, review compliance, and update content as offers change. A low platform price doesn’t make those activities free.
Build the benefit side carefully
Benefits should also have separate categories rather than one inflated total:
| Benefit category | What to measure | When it becomes financial |
|---|---|---|
| Labor savings | Manual hours removed from the process | Payroll, overtime, or contractor expense falls |
| Quality improvement | Fewer errors, incomplete records, escalations, or repeat contacts | Rework and service costs decline |
| Throughput gains | More conversations, leads, orders, or cases handled | Additional output creates contribution margin |
| Error reduction | Fewer failed handoffs, incorrect responses, or abandoned paths | Avoided costs or recovered revenue can be attributed |
| Recovered revenue | Purchases or leads recovered through automation | Incremental contribution margin is measured |
| Avoided costs | Hiring, agency, service, or infrastructure expense prevented | The planned expense is actually avoided |
For an e-commerce brand, count recovered carts only when the purchase is attributable to the automated path. Use contribution margin rather than gross sales, because fulfillment, discounts, payment costs, and product costs reduce the amount available to fund the automation. For a SaaS company, distinguish support contacts deflected from customers who just moved to another channel.
A measurement guide for incrementality testing can help teams design holdouts and avoid claiming revenue that would have happened without the intervention. The same principle applies to lead qualification. A lead generated by a bot isn’t a benefit until it progresses through a defined commercial outcome.
Put implementation work in the model
The internal project team is an expense even when no invoice arrives. Include time spent by marketing, sales, support, engineering, legal, analytics, and leadership. Add the cost of integrations, testing, training, workflow redesign, and change management.
Teams planning broader business process optimization should also model dependencies between workflows. An automation that creates more qualified leads may increase sales follow-up work. A support bot that deflects routine contacts may increase the complexity of escalated cases. The model should capture both the benefit and the workload the new process creates.
A layered measurement system works well:
- Task economics show the cost and quality of a completed interaction.
- Workflow economics show whether the complete journey creates savings or contribution margin.
- Enterprise impact shows whether the initiative changes profit, hiring needs, or revenue capacity.
This prevents a workflow from appearing profitable because it saves minutes while increasing monitoring, escalation, or acquisition costs.
Applying the Essential ROI Formulas and Metrics
Once the cost and benefit sheet is complete, use separate metrics for profitability, cash timing, and longer-term value. Combining them into one score hides trade-offs.
ROI percentage
The standard annual formula is:
ROI = ((annual benefits − annual operating costs) / total initial investment) × 100
The numerator should contain benefits that can be measured during the period, including labor savings, quality improvements, throughput gains, error reduction, recovered revenue, and avoided costs. The denominator should contain the total initial investment, including implementation, integration, training, process redesign, and internal project labor.
A simple example shows how the pieces fit. A $120,000 implementation that produces $75,000 in annual gross benefits and $15,000 in annual recurring costs creates $60,000 in net annual benefit, a 50% first-year ROI, and a 24-month simple payback, before financing and tax effects, according to this automation investment analysis.
Payback period
Payback answers a different question: how long does it take to recover the initial cash investment?
Payback = total investment / monthly net benefit
Monthly net benefit equals monthly benefits minus recurring operating costs. A project can show positive annual ROI while requiring substantial cash before break-even, so finance teams should see both figures.
Project scope changes the timing. Historical automation analysis places software-oriented deployments at roughly 2 to 6 months, robotic cells at 8 to 18 months, and complex multi-system projects at 24 to 36 months, as described in the same automation investment analysis. Those ranges aren’t substitutes for your own model. They’re a reminder that integration complexity belongs in the payback discussion.
Net present value
NPV accounts for the fact that benefits received later aren’t equivalent to benefits received immediately. Discount projected net cash flows by the company’s approved discount rate, subtract the initial investment, and evaluate the result over the chosen measurement period.
Use NPV when an automation initiative has a long rollout, meaningful future maintenance, staged benefits, or a material difference between early costs and later returns. ROI is easier to communicate, payback is useful for cash planning, and NPV is better for comparing investments with different timing profiles.
Resources on time savings through automation can help identify efficiency inputs, but those inputs still need a financial translation. For channel programs, document the process in line with marketing automation best practices and keep efficiency ROI separate from cash ROI.
Worked Examples Across E-Commerce, Agencies, and SaaS
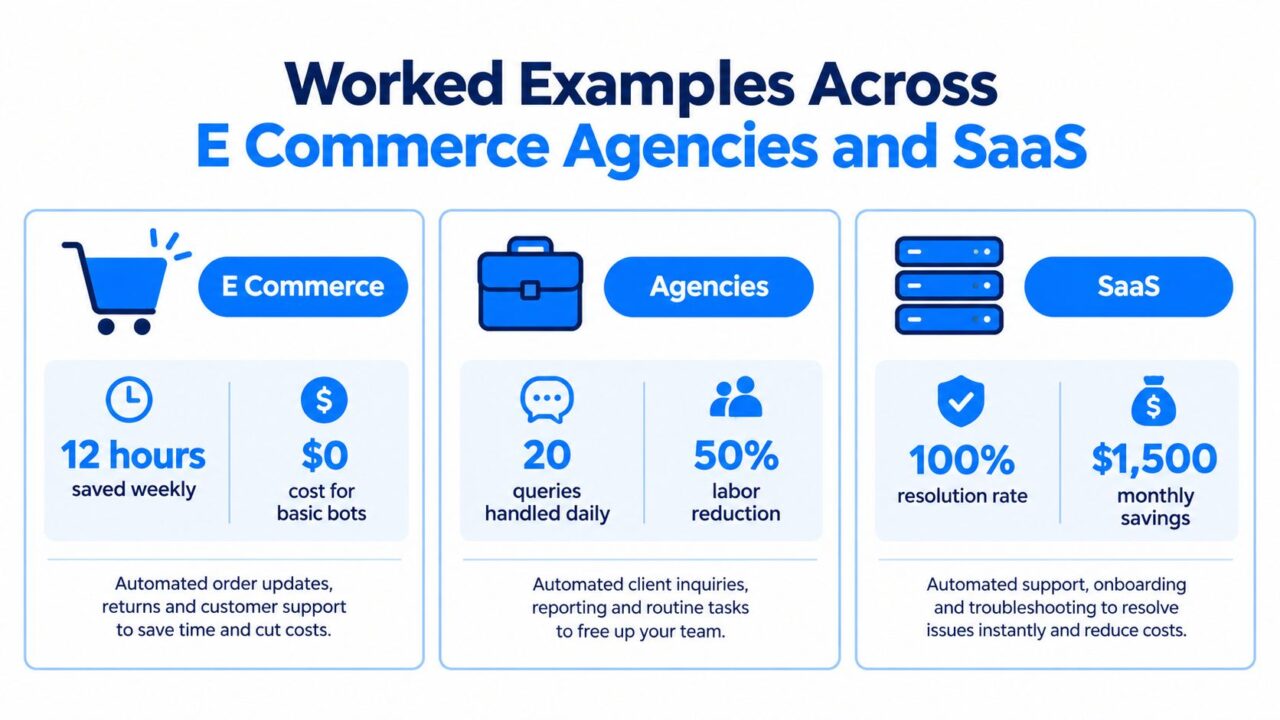
A defensible example must show its assumptions. Because unsupported case-study figures create false precision, the examples below use the same modeling logic without claiming results for a particular company.
Automation ROI Calculation Industry Comparison
E-commerce
An online retailer wants to automate Messenger and Instagram conversations around product questions, abandoned carts, and high-intent leads. The baseline worksheet should include current cart recovery, conversion by channel, support contacts, average contribution margin per order, messaging expense, and the staff time spent answering repetitive questions.
The benefit model shouldn’t credit every conversation. It should count only purchases or qualified leads that can be tied to the automated path, plus support savings that represent a real reduction in cost or a documented capacity deployment. A randomized path test can compare customers who enter the automated journey with a suitable control group, while a holdout can test whether abandoned-cart reminders create incremental orders.
The cost model should include setup, integration with the store and customer data, conversation design, content maintenance, platform and messaging fees, analytics, human handoff, and compliance review. If the workflow depends on product or pricing data pulled from other sites, a lightweight Scrape API can supply it, but the cost and reliability of that data process belong in the model too.
For a brand using e-commerce automation, the final calculation should report contribution margin from attributable orders, avoided support cost, recurring operating cost, initial investment, ROI, and payback separately. If the automation only saves staff time and the team has no plan to use that capacity, report capacity value instead of presenting it as cash savings.
Digital agency
An agency managing multiple client accounts should model each client deployment separately before creating an aggregate view. Setup work may differ by client because each account has different channels, integrations, offers, approval processes, and reporting requirements.
The agency’s benefits may include reduced campaign operations, faster lead routing, lower manual reporting effort, and the ability to manage additional work without immediate hiring. Capacity value is especially important here, but it should remain separate from cash savings unless the agency can show that the capacity supports additional billable work or avoids a planned hire.
Recurring management work also belongs in the denominator. Include monitoring, client approvals, content revisions, troubleshooting, analytics, and time spent handling exceptions. A bot that reduces routine work but creates a large queue of unusual cases may not improve margin.
SaaS
A SaaS company automating onboarding and tier-one support should connect each workflow to a commercial or cost outcome. Useful baseline inputs include trial-to-paid conversion, onboarding completion, support contact volume, escalation rate, support cost per contact, and the contribution margin associated with retained or converted customers.
The model should distinguish between a user who receives an automated answer and a user whose issue is resolved. It should also track whether the automation changes the customer journey, reduces repeat contacts, or just shifts questions into email or live chat.
A credible forecast can therefore show several lines rather than one blended claim:
- Conversion contribution: Incremental paid customers multiplied by contribution margin.
- Support savings: Contacts avoided multiplied by the defensible cost per contact.
- Quality cost: Rework, escalations, failed responses, and human review.
- Operating cost: Platform, integrations, monitoring, content, and maintenance.
- Capacity value: Additional onboarding or support work the existing team can absorb.
The same formula applies across all three models. The inputs change, and the attribution risk changes with them.
Running Sensitivity Scenarios for Confidence
A single ROI number can make a forecast look more certain than it is. Time saved only becomes financial return when the released capacity lowers actual spend, supports additional profitable work, or improves attributable revenue. Test what happens when volume falls, implementation takes longer, adoption remains partial, or recurring costs increase.
Use three views:
- Conservative: Reduce attributable volume, delay benefits, and allow for greater oversight or implementation effort.
- Expected: Apply baseline assumptions supported by current operating data.
- Upside: Model stronger adoption or conversion only when a specific operational change justifies it.
A Deloitte survey covered 479 executives across 35 countries. Organizations that moved beyond intelligent-automation pilots reported average operational cost reductions of 32%, compared with 24% in 2020. Organizations piloting intelligent automation reported an average payback period of 22 months, compared with 16 months in 2020, according to this workplace automation evidence. These figures show that maturity and timing vary. They should inform scenario design, not become default assumptions for your project.
Create a sensitivity matrix
Change one important variable at a time before testing combinations. Useful inputs include attributable conversion, process volume, labor deployment, implementation duration, platform cost, maintenance effort, and escalation rate. Also separate hours removed from hours that produce measurable financial value. A team may save time without reducing payroll or increasing output.
A scenario illustrates the mechanics. If automation is expected to save $100,000 annually, but only 70% of projected volume materializes, benefits fall to $70,000. After $20,000 in recurring costs, net annual benefit is $50,000 against a $150,000 initial investment. That produces a 33.3% annual ROI and a 36-month simple payback. The calculation is useful because it exposes how quickly weaker adoption changes the result.
The downside case is the test that shows whether the investment can withstand ordinary execution risk.
Report the break-even point for each key assumption. If the project works only with immediate adoption, full contact deflection, and perfect conversion attribution, the model is fragile. If it remains viable with slower uptake and higher oversight, leadership can approve it with a clearer view of the risk.
Your Implementation Checklist and Next Steps
Turn the model into an operating document rather than a one-time approval sheet.
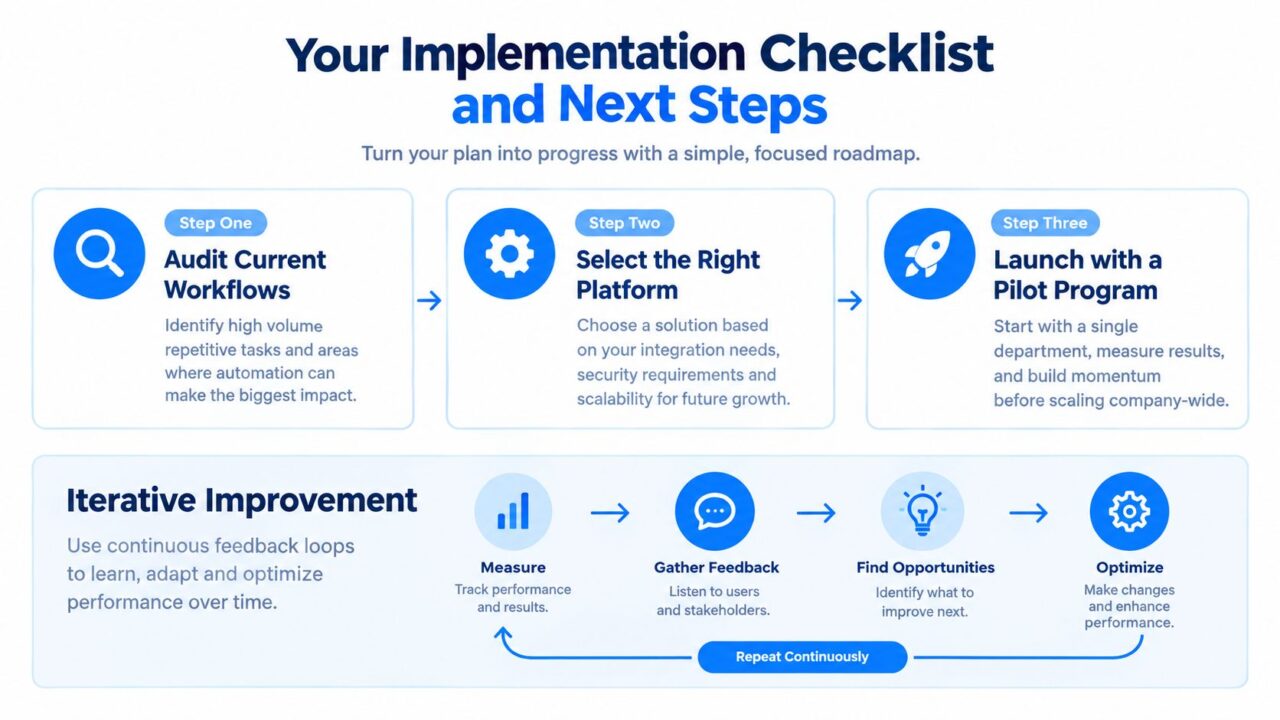
Automation ROI Calculation Implementation Checklist
- Audit current workflows: Find repetitive, high-volume tasks and document their baseline cost, quality, and commercial effect.
- Select the right platform: Check integrations, data access, handoffs, monitoring, compliance, and scalability before comparing subscription prices.
- Launch a focused pilot: Start with one workflow, define attribution, and measure qualified leads, recovered interactions, support contacts, contribution margin, and human oversight.
- Review the model continuously: Compare actual performance with conservative and expected assumptions, then update costs, benefits, and payback as evidence improves.
Don’t claim a win because a bot handled conversations. Claim it when attributable revenue, avoided cost, cash savings, or deployed capacity appears in the operating results.
If your team needs to connect conversational workflows with a defensible automation ROI calculation, Clepher provides no-code automation for marketing, sales, and support across website chat, Messenger, WhatsApp, and Instagram Direct Message. Build a measured pilot, track the financial outcomes that matter, and use the results to decide where automation deserves further investment.