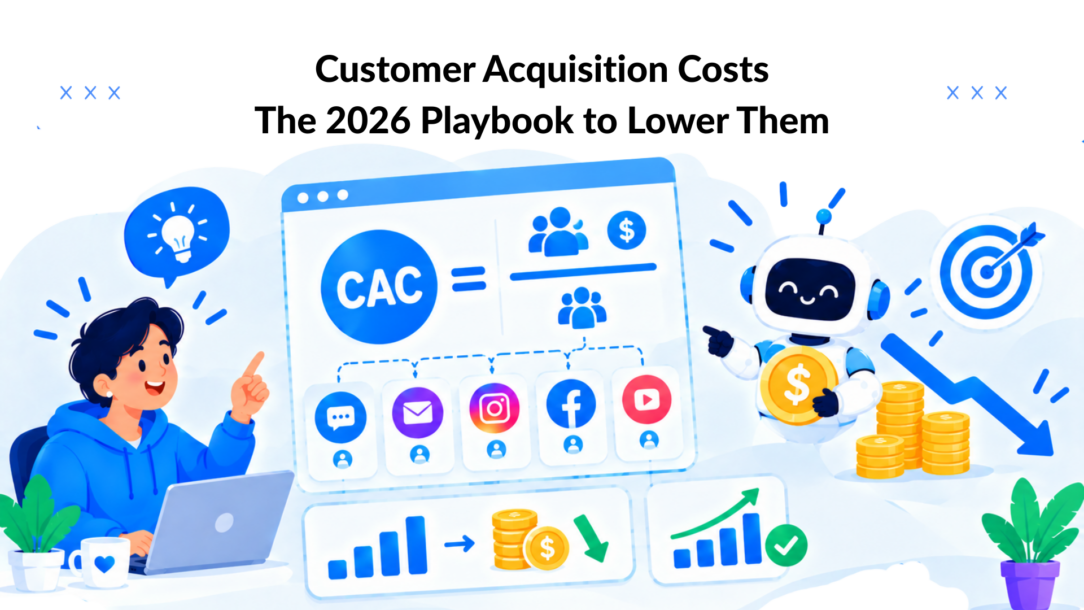
Customer acquisition cost has become one of the least trustworthy numbers in growth marketing. Costs rose by 60% over the previous five years, while another summary citing SimplicityDX research reports a 222% increase over eight years. Yet many teams still judge performance from platform-reported CPA and a blended CAC spreadsheet that hides organic, referral, lifecycle, and retention effects. The latest customer acquisition statistics make the problem clear, but the solution isn’t another round of ad tweaks.
Treat CAC as a measurement and lifecycle problem, not just a paid-media problem. The operators who lower customer acquisition costs consistently connect channel-level math to payback, retention, first-party capture, and customer lifetime value. They don’t scale a channel because its dashboard looks efficient. They scale it because the customer economics remain profitable after attribution, margin, and time to recovery are included.
Why Your Customer Acquisition Cost Number Is Probably Wrong
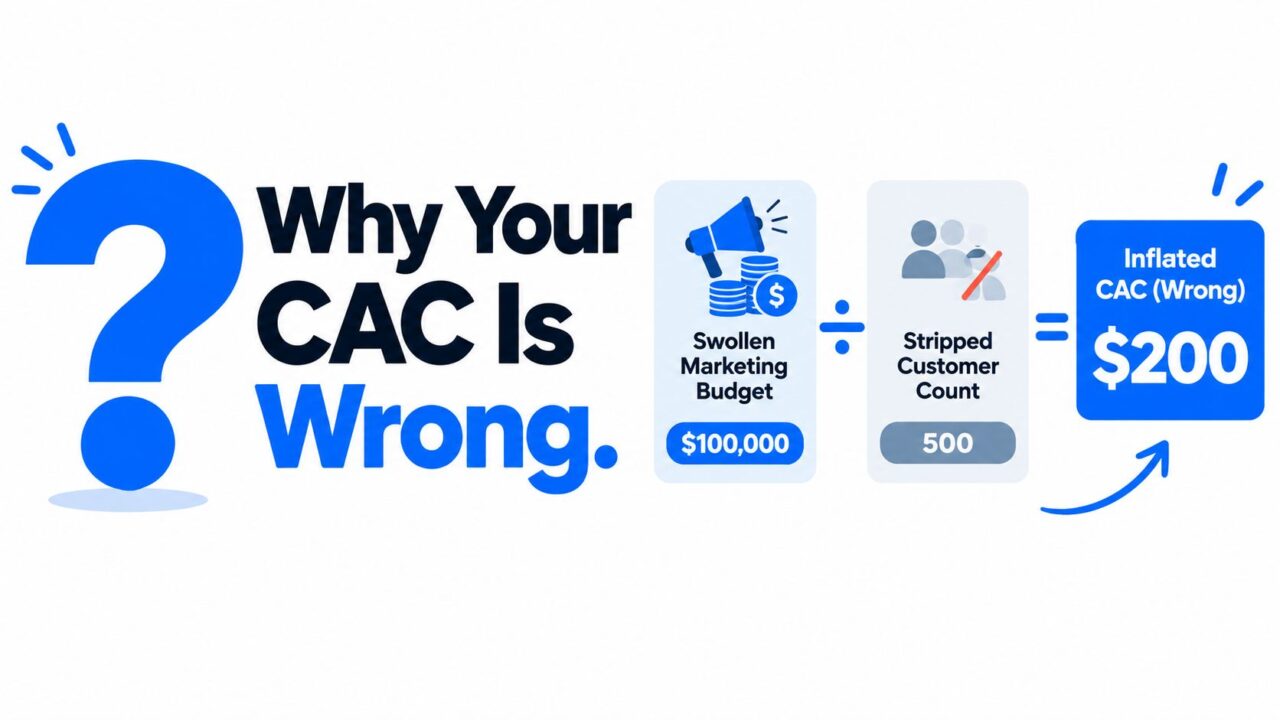
CAC has become the most misreported number in growth marketing. Teams often divide a swollen marketing budget by a stripped-down customer count, then treat the result as a precise view of acquisition efficiency.
That calculation can be directionally useful, but it leaves out the conditions that decide whether growth is healthy. It may include brand spend that didn’t create demand, exclude sales and marketing labor that did, credit a platform for a conversion influenced by email, and ignore whether new customers stay long enough to repay the acquisition investment.
Customer Acquisition Costs CAC Miscalculation
The measurement errors hiding inside blended CAC
Attribution decay makes the issue worse. Privacy changes, fragmented journeys, and overlapping paid, organic, referral, and owned interactions mean a customer may click an ad, read a guide, join a community, receive a message, and purchase after a direct visit. A last-click report usually assigns the sale to only one of those touches. A useful primer on this problem is marketing attribution and its role in growth reporting.
The customer count can also be wrong for the decision you’re making. A blended figure may combine first-time buyers with reactivated customers, self-serve SaaS signups with enterprise accounts, or customers acquired through paid search with customers generated by existing subscribers. Those groups don’t share the same sales cycle, margin, retention, or expansion potential.
Practical rule: Never approve a budget change from blended CAC alone without considering the cost to acquire. Ask which customers the spend acquired, which channel influenced them, and how long the company needs to recover the cost.
The workable frame is simple:
- Define CAC correctly, including the relevant costs and customer window.
- Break it down by channel, campaign, audience, and customer type.
- Compare it with LTV, gross margin, and payback to evaluate the cost of acquiring a customer, not revenue alone.
- Reduce dependence on incremental ad spend through chat, capture widgets, segmentation, referrals, email, community, and automation.
That approach changes the question from “How do we lower our ads?” to “How do we create more customers from every interaction we already paid to generate?” It also exposes when a higher measured CAC is acceptable because retention and lifetime value are stronger, and when a cheap-looking channel is just producing low-quality leads.
What Customer Acquisition Cost Actually Means
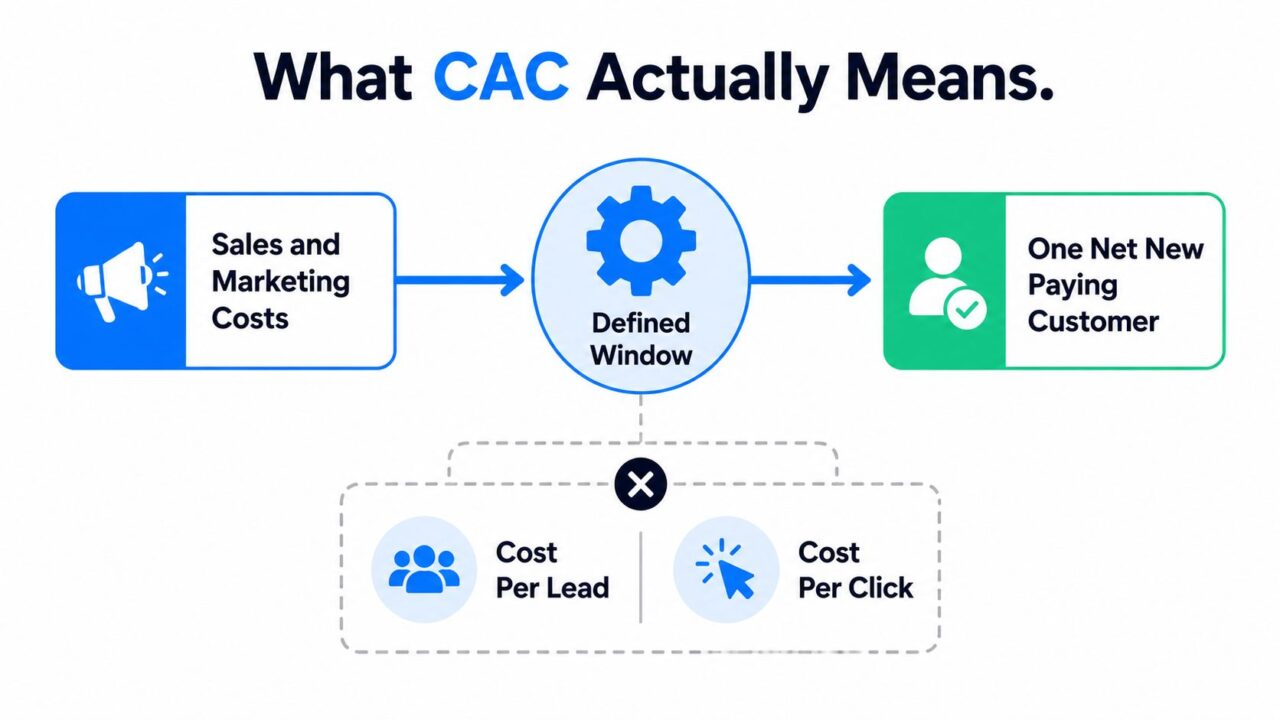
Customer acquisition cost is the fully loaded sales and marketing cost required to convert one net new paying customer inside a defined period. It isn’t the same as cost per lead, cost per click, cost per install, or cost per trial. Those are event-level metrics. CAC measures the cost of reaching an actual paying customer.
The basic formula is:
CAC = total acquisition costs ÷ net new paying customers
Total acquisition costs can include:
- Media spend, including paid search, paid social, sponsorships, and retargeting.
- People costs, including sales salaries, marketing salaries, commissions, and allocated contractor time.
- Production costs, including creative, content, design, video, and landing pages.
- Technology costs, including analytics, CRM, marketing automation, chat, and data tools.
- Agency and partner fees, including campaign management, affiliate commissions, and consulting.
Customer Acquisition Costs CAC Breakdown
A repeatable calculation
Suppose a SaaS company spends $280,000 across a quarter and closes 1,400 new customers in that same quarter.
$280,000 ÷ 1,400 = $200 blended CAC
That is a valid starting point if the period, spend, and customer count align. Now add onboarding costs of $46,200 to the acquisition pool:
$326,200 ÷ 1,400 = $233 CAC
If the company nets out $35,000 in expansion revenue associated with those new customers, the adjusted acquisition cost becomes $245,000, producing:
$245,000 ÷ 1,400 = $175 CAC
Those adjustments aren’t automatically right or wrong in terms of acquisition strategies. They answer different operating questions. The first number describes sales and marketing efficiency. The second includes onboarding resources. The third treats expansion revenue as an offset. Your finance and growth teams need to agree on the definition before comparing periods.
The window changes the answer
CAC is always a ratio of period-bound costs to period-bound customers. A monthly view can swing sharply when a sales team closes deals generated by earlier campaigns. A quarterly view may smooth that timing. An annual view can hide a deteriorating channel behind strong performance from an earlier period.
Use the same window for spend and customer acquisition, then publish the definition beside the number. If a report doesn’t show its cost pool, customer cohort, attribution rule, and time window, it’s not a management metric. It’s an unexplained output.
How to Calculate Customer Acquisition Costs by Channel
Blended CAC tells you whether the whole machine is moving efficiently. Channel CAC tells you what to change.
The channel formula is:
Channel CAC = channel-specific acquisition spend ÷ net new customers first attributed to that channel
Use channel-specific spend, not just media invoices. Allocate creative, tooling, agency fees, and relevant headcount. Then decide whether the customer count uses first touch, last touch, position-based, time decay, or an incrementality approach.
Build the channel math
Consider a business tracking five acquisition routes:
- Paid search: Add Google Ads spend, search creative, landing-page work, and the allocated time of the person managing campaigns. Divide the total by customers first attributed to paid search.
- Paid social is a crucial channel to acquire new customers. Include Meta or TikTok spend, creative production, audience research, and campaign management. Separate prospecting from retargeting because they serve different jobs.
- Organic content: Allocate editorial, SEO, design, and content distribution costs. Count customers who enter through tracked organic content, while monitoring assisted conversions separately.
- Affiliate: Include commissions, network fees, and partner management. Use net new paying customers, not affiliate clicks or coupon redemptions.
- Outbound sales: Include prospecting tools, sales development labor, account executive time, and relevant enablement. For teams combining cold email with pipeline management, this guide to cold email and pipeline synergy is a useful reference for connecting activity to closed revenue.
The attribution choice matters. First-touch CAC is useful for demand creation. Last-touch CAC is useful for conversion capture. Position-based or time-decay models can better represent a multi-touch journey, but they still rely on assumptions. Don’t compare a first-touch organic CAC with a last-touch paid social CAC and call the difference a performance win.
Customer Acquisition Cost Ranges by Channel 2026
| Channel | Typical CAC range USD | Required inputs | Best attribution choice |
|---|---|---|---|
| Referral marketing | $15 to $50 | Incentives, referral software, program management | First touch plus assisted conversion |
| Organic search | $70 to $120 | SEO labor, content, tools, technical work | First touch or position-based |
| Content marketing | About $92 | Writers, design, distribution, tooling | Position based or time decay |
| Affiliate marketing | $100 to $200 | Commissions, network fees, management | Last touch with quality review |
| Paid search | $200 to $350 | Media, creative, landing pages, management | Position based or incrementality |
These ranges come from channel-level customer acquisition cost benchmarks. Treat them as reference points, not targets. A $200 paid-search CAC can be excellent for a high-margin subscription and disastrous for a low-margin single-purchase product. A $40 referral CAC can look cheap while producing customers who churn quickly.
Tie every channel to gross profit, retention, and payback. The channel with the lowest acquisition cost isn’t necessarily the channel that deserves more budget. The right winner creates profitable customers at a pace the business can finance.
Benchmarks and the LTV to CAC Reality Check
CAC becomes useful only when it sits inside a profit equation. A standalone acquisition number can’t tell you whether growth is sustainable because it says nothing about margin, average revenue per user, repeat purchase behavior, or customer lifespan.
A company selling a high-margin subscription can tolerate a higher CAC than a retailer selling a low-margin first order. A SaaS business with a long contract may recover acquisition cost over time. A DTC brand that relies on repeat purchase must make the second and later orders visible in its model.
Use the benchmark as a starting point
A 2026 industry benchmark reports combined average CAC of $239 for B2B SaaS, with $205 for organic channels and $341 for inorganic channels. The same benchmark set reports $86 for eCommerce, $260 for entertainment, $281 for construction, $362 for environmental services, $387 for cybersecurity, and $454 for IT and managed services. CAC can vary by more than 13 times across B2B industries, so a universal “good CAC” target is bad management. The industry benchmark table shows why business model and sales complexity must stay in the discussion.
For SaaS, self-serve or product-led acquisition is commonly benchmarked around $50 to $200, while mid-market and enterprise acquisition can reach $600 to $1,200 or more, and sometimes $5,000 or more per customer. Operators often manage that against a 12 to 18 month payback target and an LTV:CAC ratio near 3:1 or better. The 2026 B2B SaaS benchmark analysis provides that range and the underlying sales-complexity context.
| Business Model | Blended CAC Range | Healthy LTV:CAC | Target Payback Period | Key Margin Driver |
|---|---|---|---|---|
| B2B SaaS | $300 to $1,400 | At least 3:1 | 12 to 18 months | Gross margin and retention |
| DTC e-commerce | $45 to $120 by category | At least 3:1 | Driven by repeat purchase | AOV and reorder rate |
| Mobile apps | $3 to $7 blended | Business-specific | Driven by retention | D7 retention and monetization |
Payback is the operating constraint
The formula is to reduce customer acquisition cost effectively:
Payback period = CAC ÷ monthly gross profit per customer
A more explicit version is:
CAC ÷ (monthly ARPU × gross margin) × 30 days
Take a SaaS example with $480 CAC, an 80% gross margin, and $180 monthly ARPU. Monthly gross profit is $144, so payback is approximately 3.3 months, not two. If the business uses revenue rather than gross profit, it may report a shorter but less useful period. At a 24-month lifetime, the revenue value is $4,320, and the gross-profit value is $3,456, producing a gross-profit LTV:CAC ratio of 7.2:1.
For DTC, $65 CAC, $65 AOV is essential for determining the cost to acquire effectively, and a 55% margin produces $35.75 gross profit on the first order. That order doesn’t break even on gross profit. The brand needs a repeat purchase to recover the cost of acquiring the customer.
Use customer lifetime value strategies to improve the denominator of the LTV:CAC equation, not to excuse poor acquisition discipline. If payback exceeds 12 months, cut acquisition spend and fix retention before scaling. A 2026 SaaS benchmark reports a 16-month median CAC payback, 10 months or less for the top quartile, and 24 months or more for the bottom quartile. The CAC payback benchmark gives the practical warning: slow recovery makes growth capital-intensive.
The Three CAC Pitfalls That Quietly Inflate Your Number
Bad CAC reporting doesn’t usually fail because someone can’t divide. It fails because the team chooses a denominator and attribution rule that flatter the story.
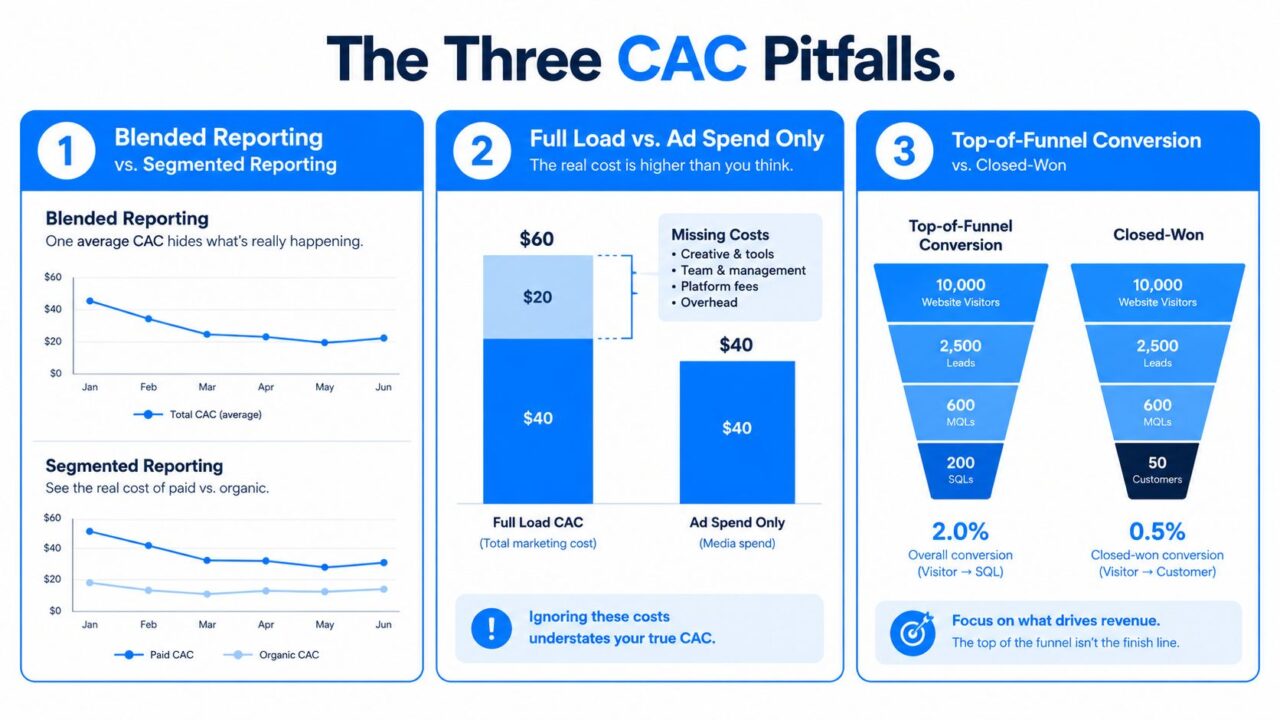
Customer Acquisition Costs CAC Pitfalls
Pitfall one is blended-only reporting
A blended dashboard might show $200 CAC across paid and organic activity. That figure can hide paid CAC of $300 and organic CAC of $0 marginal cost for an already-created asset. It can also hide the reverse, where organic appears efficient only because the team excludes content, SEO, and labor costs.
The fix is separate reporting:
- Paid CAC: Media, creative, tooling, and paid-channel labor divided by paid-attributed customers.
- Organic CAC: Fully loaded content and SEO costs divided by organic customers.
- Product-led CAC: Product, onboarding, and lifecycle costs divided by customers who convert through the product path.
The goal isn’t to make organic look expensive or paid look bad. The goal is to know which channels can absorb another dollar.
Pitfall two is last-click attribution
Last click is convenient, not neutral. It rewards the touch closest to purchase and often undervalues awareness, education, community, and comparison content. Don’t accept the claim that platforms such as Meta Advantage+ or Google Performance Max under-report upper-funnel value by 30% to 60% unless you have a verified experiment supporting that exact result. The correct response is to test incrementality rather than repeat a dramatic percentage.
Run geo holdouts, matched-market tests, or controlled budget pauses. Use marketing mix modeling when the business has enough reliable data. Compare assisted conversions with closed-won customers, not just clicks.
Pitfall three is treating CAC as paid-only
A paid-only report can show a campaign at $100 CAC while excluding the content team, marketing automation, sales development, and customer onboarding that made conversion possible. Add $20,000 of omitted costs to $80,000 in reported spend and retain the same number of new customers. 800 customers, and the number moves from $100 to $125.
That isn’t a reporting nuisance. It changes the budget decision related to the number of new customers. Allocate team time and tooling across acquisition channels, then distinguish fixed costs from marginal costs. CAC is a measurement discipline, not a line item reserved for the advertising manager.
Tactical Strategies to Lower Customer Acquisition Costs
Lowering CAC starts with finding the leak between attention and retained revenue. Paid, owned, and lifecycle tactics should work as one system, with chat and automation connecting the handoffs.
Paid levers
Paid media still matters, but many teams waste time changing bids before fixing creative and signal quality.
- Refresh creative consistently. Test at least 5 variants weekly when volume supports it. Vary the opening promise, proof, format, and objection rather than changing button colors.
- Consolidate audiences. Too many small ad sets reset learning and fragment conversion signals. Combine audiences when the customer problem, offer, and buying intent are materially similar.
- Work around signal loss. Use server-side events, first-party identifiers, clean consent capture, and deduplication. Don’t expect platform optimization to recover data your stack never records.
- Set a target CPA. Calculate the maximum allowable CPA from gross margin and payback, then judge campaigns against that ceiling rather than a platform benchmark.
A paid-per-click audit can expose wasted spend, tracking gaps, search-term problems, and landing-page mismatches before the team increases budget.
Owned channels
The cheapest conversion is often the one generated from traffic you’ve already purchased. Put a capture widget on high-intent pages, offer a relevant lead magnet, and ask a qualifying question instead of forcing every visitor into a generic form.
A conversational flow can identify product fit, route a high-intent visitor to sales, deliver a guide, and capture permission for follow-up. The 15% to 30% landing-page conversion lift can significantly reduce customer acquisition. Sometimes used in planning, it should be treated as a test range, not a guaranteed outcome. Measure the actual change against a control page and calculate effective CAC from resulting customers, not captured contacts.
Clepher is one option for designing no-code conversational Flows, capture widgets, broadcasts, segmentation, AI Agents, and integrations across website and messaging channels. Use it as part of a measurement plan, not as a substitute for offer quality or attribution discipline.
For DTC operators, this practical CAC reduction guide is useful for reviewing channel mix, conversion friction, and retention economics.
Lifecycle levers
Lifecycle programs lower effective CAC by producing more revenue from each acquired customer:
- Trigger re-engagement when a trial user stalls, a buyer views a product repeatedly, or a subscriber approaches cancellation.
- Recover abandoned carts with a timely chat prompt or message that answers the actual objection.
- Create post-purchase upsells based on product use, replenishment timing, or plan limits.
- Segment by intent. Separate high-intent visitors, new leads, active customers, dormant customers, and repeat buyers.
- Track the retention delta. Set a target for repeat purchase rate, activation rate, or churn reduction, then connect that change to gross-profit payback.
Instrument the system before launch:
- UTM mapping: Use consistent campaign, source, medium, audience, and creative fields.
- Server-side events: Send key conversion events from a reliable backend source.
- Event deduplication: Prevent browser and server events from counting the same conversion twice.
- Customer IDs: Connect anonymous visits, leads, purchases, and renewals where consent permits.
- Cohort reporting: Compare customers by acquisition month, channel, offer, and first product to analyze the cost of acquiring each segment.
Operating principle: Chat and automation should connect paid attention to owned conversion, then connect first purchase to repeat revenue.
A 30-60-90 Day Plan to Bring CAC Under Control
A CAC program needs a sequence. Start by making the number trustworthy, then improve conversion, then shift investment toward channels that compound.
Days 1 to 31
Rebuild the reporting foundation. Publish blended CAC beside the cost to acquire paid, organic, referral, product-led, and outbound CAC. Document the spend pool, customer definition, time window, and attribution model for every dashboard.
Fix obvious attribution decay with time-decay or position-based models where they fit the buying journey. Add assisted conversions and closed-won revenue to channel reports. The early signals are better data completeness, fewer unattributed customers, and a clearer gap between lead cost and customer cost.
Don’t optimize campaigns yet. First, make sure the team is looking at the same customer and the same cost definition.
Days 32 to 60
Run focused conversion experiments. Tighten creative, exclude existing customers from prospecting, remove low-intent audiences, and align each ad with its landing-page promise.
Add a capture widget to the highest-intent traffic pages. Build a welcome automation that qualifies leads before sales contact, routes urgent opportunities, and delivers the right next step to acquire a new customer. Create basic segments for high-intent visitors, new leads, abandoned carts, and existing customers.
Monitor qualified-lead rate, assisted-conversion cost, lead-to-customer conversion, and the gap between platform CPA and measured channel CAC. A lower lead cost with no improvement in closed customers is not progress.
Days 61 to 90
Shift from isolated experiments to compounding channels. Expand referral and community programs, improve onboarding, and identify the lifecycle actions that increase activation, repeat purchase, or reduce customer acquisition.
Reallocate budget toward channels beating target CAC by at least 15%, but only after checking customer quality and payback. A channel that beats target CAC while producing weak retention isn’t a winner. A channel with slightly higher acquisition cost and materially stronger lifetime value may deserve more investment.
Track payback-period compression, retention movement, repeat purchase behavior, qualified-lead rate, and cost per assisted conversion. By the end of the period, the business should know which costs are incremental, which channels create durable demand, and where automation can turn existing attention into more customers.
Use Clepher to connect conversational lead capture, qualification, segmentation, broadcasts, and lifecycle automation across the channels where prospects already engage. Start by instrumenting one high-intent page and one recovery flow, then measure the change in qualified customers, effective CAC, and payback before expanding the program.