
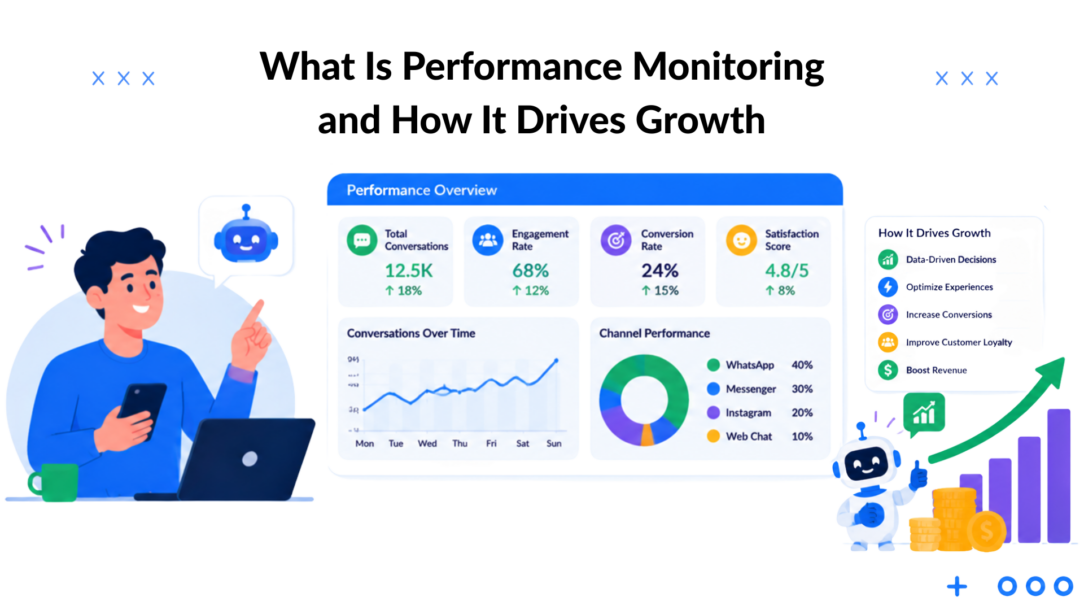
Performance monitoring is the continuous tracking of CPU, latency, error rate, open rate, and conversion so teams can spot performance issues before customers do. It’s the habit of comparing live behavior against a baseline, then acting on the difference.
You’re probably staring at a dashboard like this already, or at least juggling too many browser tabs that don’t quite agree with each other. A chatbot flow looks fine on paper, a broadcast goes out, traffic comes in, and somewhere between the click and the conversion, the numbers go quiet.
What Performance Monitoring Really Means in 2026
A DTC manager opens her analytics on Monday and sees a chatbot flow that converted well last week now sagging badly. Nothing in the copy changed, the offer is the same, and the audience didn’t vanish. What changed is the behavior, and that’s exactly where performance monitoring starts.
In plain English, performance monitoring is the continuous collection and analysis of operational data to understand how a system behaves over time, with teams watching for deviations from a baseline and using alerts and trend analysis to catch issues early. Alibaba Cloud performance monitoring indicators are essential for assessing system performance. Modern practice usually includes metrics like CPU usage, memory usage, disk I/O, network bandwidth, response time, error rate, concurrency, logging, resource utilization, and transaction volume.
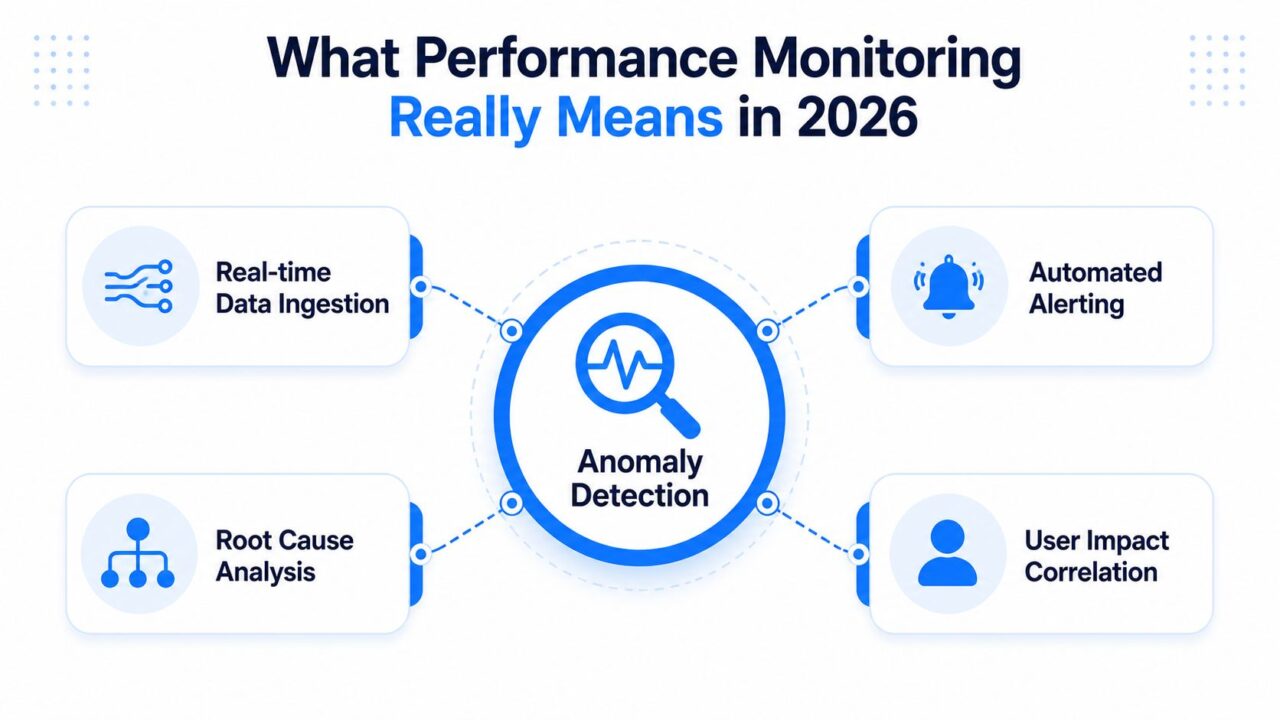
Performance Monitoring Anomaly Detection
The useful mental model is simple. You define what normal looks like using performance metrics, then you watch for drift. If a flow’s completion rate drops, a page slows down, or a broadcast gets fewer opens than expected, monitoring helps you find the break before the user experience turns into lost revenue.
Practical rule: If a metric doesn’t help you decide whether to fix, pause, scale, or investigate, it’s just decoration.
This is why performance monitoring stopped being a pure backend topic. It now sits inside marketing ops, growth, support, and revenue teams because technical health and customer behavior are tightly linked. A slow response time can kill a chatbot handoff. A noisy error pattern can hide a funnel leak. A bad send can flatten engagement before a campaign finishes.
The easiest way to think about it is as a feedback loop, not a report. One-off reporting tells you what happened. Monitoring tells you what’s changing in real-time, so you can do something about it. For a related marketing lens, see what marketing analytics actually measures, because monitoring only becomes useful when it connects to decisions.
The Four Layers of Performance Monitoring
The best monitoring stacks don’t start at the top. They start with the plumbing, then move upward until the team can see the customer experience and the business result in one chain.
Infrastructure monitoring
This is the base layer, the stuff that keeps the system standing. It watches CPU, memory, disk, and network, the same way a building’s plumbing and wiring keep the kitchen usable. If these signals are unhealthy, every higher layer starts to wobble.
Infrastructure monitoring answers a simple question: is the machine itself under stress? That matters because a slow app isn’t always a bad campaign or a broken flow. Sometimes the server is just running hot, the disk is saturated, or the network is congested.
Application monitoring
This layer watches how the code and services behave under load. Here you care about response time, throughput, error rate, and queue depth, because those are the signals that show whether the product can keep up with demand. This is the level where a CRM timeout, a webhook failure, or a bottleneck in a checkout step becomes visible.
The engine in a delivery van illustrates the concept. The van may look fine from the outside, but if the engine is misfiring, the route slips behind. Application monitoring tells you whether the engine is doing its job.
User-experience monitoring
Now the focus shifts from systems to people. You watch what the user feels, how fast a page renders, how quickly the first chatbot message appears, and where people drop out of a flow. If a team only watches infrastructure, it can miss the fact that users are already frustrated.
This layer is where marketing ops and growth teams usually start recognizing their own work. A message may technically send, but if users never reach the booking step, the experience still failed. The metric that matters is the one the customer experiences, not the one that looks tidy in a backend log.
Synthetic monitoring
Synthetic monitoring is the proactive layer. You simulate journeys on a schedule, like launching a test conversation, loading a landing page, or triggering a broadcast path, so you can catch failures before real people do. It’s the difference between checking the oven before the dinner rush and discovering the heat died after the order board filled up.
Mature teams use all four layers together. That gives them a stack where server health, service behavior, user experience, and business outcomes can be read as one system instead of four disconnected reports. In a chatbot platform, that means watching the underlying service, the flow itself, the engagement in the conversation, and the downstream action all at once.
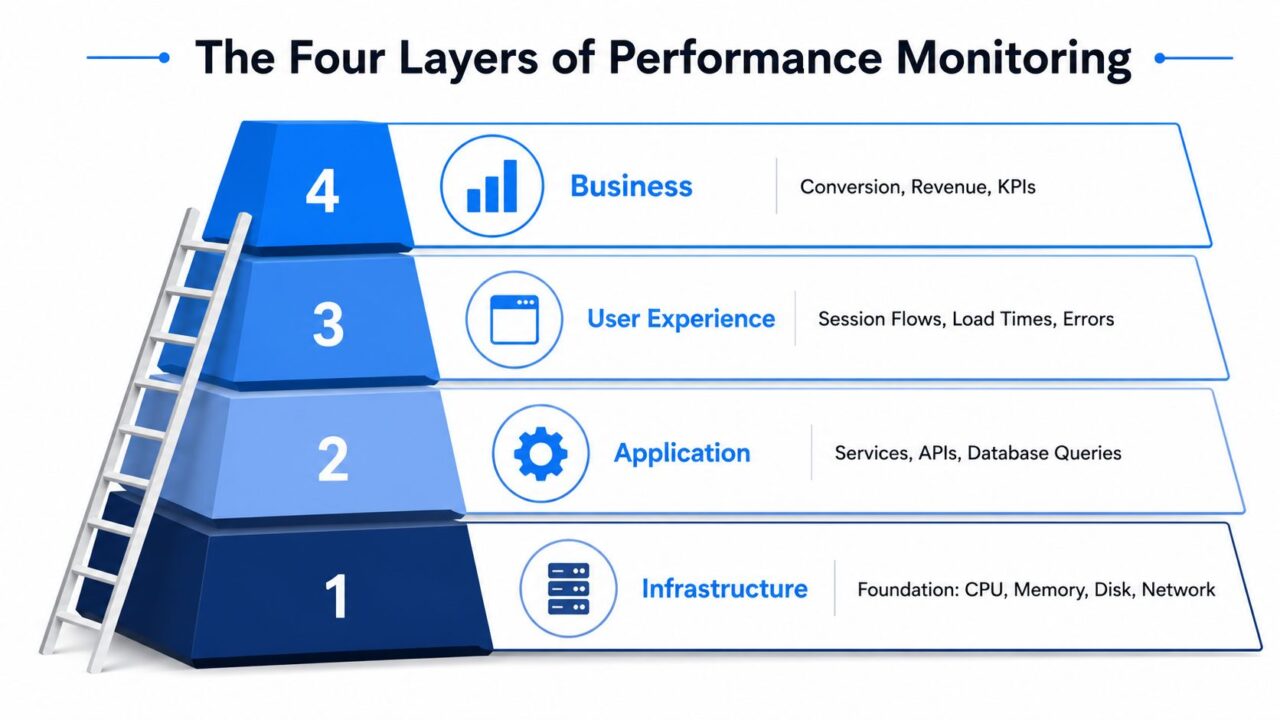
Performance Monitoring Pyramid Diagram
Key KPIs You Should Be Tracking Every Day
A dashboard is only useful when each metric answers a real question. If it doesn’t tell you where to look next, it’s just a pretty screen.
Technical health metrics
Latency answers, “How long does the system take to respond?” Averages can hide trouble, so p95 and p99 matter because they expose the slow tail that users feel, according to MetricFire. Error rate answers, “How often is the system failing?” Uptime answers, “Is the service performance data available?” Throughput answers, “How much work is it handling?”
The right threshold depends on your stack, but the warning sign is always the same: a metric moves away from its baseline and stays there. If p95 latency rises while CPU stays flat, the problem is more likely queueing or a downstream dependency than raw compute saturation. Microsoft performance monitoring guidance includes using monitoring tools effectively. If CPU and disk I/O climb together, you’re probably looking at capacity or workload pressure.
User experience metrics
Time-to-first-message answers, “Did the conversation feel immediate?” Flow completion rate answers, “Did users make it through the path?” Drop-off step answers, “Where did they quit?” Session duration tells you whether people stayed engaged long enough to reach the action.
A flow can be technically healthy and still fail the user. If the next step is confusing, the metric that moves first is usually completion, not uptime.
Use these signals to find friction. A low completion rate often means one step is doing too much work, asking for too much context, or using language that sounds clear to the team but not to the customer. If a broadcast sends traffic but people stop interacting almost immediately, the issue may be message fit, timing, or the handoff after the first click.
Business impact metrics
Open rate answers, “Did the message get attention?” Click-through rate answers, “Did the message create curiosity or intent based on performance data?” Conversion rate answers, “Did the journey create the outcome?” Revenue per bot conversation is a crucial performance metric. and recovered carts connect the flow to money.
That’s where monitoring becomes a growth practice instead of a technical one. If you also manage marketplace operations, even Amazon seller performance help is built around the same logic, watch the signal that reflects customer and business health, not just the existence of a process.
A good KPI is one someone can act on. If no one knows whether the next move is to rewrite copy, check timing, inspect a dependency, or scale capacity, the metric is too vague to matter.
How to Build a Monitoring Strategy That Actually Works
A working monitoring setup is less about fancy tooling and more about flow. Collect the right signals, turn them into meaningful numbers, show them in a way people can read fast, and alert only when action is needed.
Collect the right signals
Start with the user-facing path. For a chatbot journey, that means events like flow starts, button clicks, message sends, form fills, broadcast opens, and handoffs to another channel. For the surrounding stack, you also want page load time, API response time, and failure events on the services that support the conversation.
Skip noise that doesn’t change decisions. If a field is never used in a report, never drives an alert, and never helps explain a failure, it’s probably excess. Monitoring should feel like a microscope, not a warehouse.
Aggregate before you drown in events
Raw events are hard to use by themselves. They need to be rolled into counts, rates, time buckets, and comparisons against baseline behavior. That’s where the data becomes readable enough for a dashboard and actionable enough for a weekly review.
This is also where productivity can be significantly impacted. How to track website visitors fits into a broader monitoring mindset, because the point isn’t just collecting visits. The point is turning visits, clicks, and exits into a view of how the journey behaves in practice.
Visualize what matters
A useful dashboard shows four things at a glance: the current value, the baseline, the trend, and the decision it implies. If a metric is red, the viewer should know whether to pause a send, inspect a step, check a dependency, or escalate.
That means one screen should tell a story. “Completion is down, here’s the baseline, here’s when the drop started, and here’s the step that changed” is useful. “Here are 47 numbers” is not.
Alert on symptoms people feel
Use alerts for user-visible pain, not internal trivia. p95 latency is more useful than average latency because it reflects the slow experience that real people notice. In distributed systems, instrument the critical path and correlate metrics, traces, and logs with consistent metadata so you can separate a slow dependency from a compute bottleneck.
Monitoring can become a performance problem if every event is logged and every step is blocked on a monitoring call. Keep the defaults sane, sample high-volume events, aggregate at the edge where you can, and never let monitoring slow the user path.
Real Examples From Chatbot and Marketing Campaigns
A lead-generation flow started feeling off before the team could explain why. The p95 message-delivery time crept from 1.2 seconds to 4.8 seconds over a week, and the monitoring trail pointed straight to a downstream CRM call that was timing out. The fix was small, a timeout adjustment and a fallback path, but the win was that the problem showed up as p95 delivery time, not as a vague complaint from sales.
A DTC brand launched a broadcast with a copy change and watched the open rate fall from 42% to 11% after the variant went live; we analyzed the system performance. The A/B test dashboard caught the regression before the full send finished, which meant the team protected roughly 60% of the list of key performance indicators from the weaker version. The metric that mattered was the open-rate collapse, and the action was to stop the send and revert the message angle.
A coaching business had a chatbot that captured emails but still didn’t convert. The flow-completion metric exposed a confusing calendar-booking step, where people kept arriving and then leaving without committing. The fix wasn’t a redesign; it was a single plain-language clarifying message that told people exactly what would happen next.
Good monitoring doesn’t just find failure. It shows you which part of the journey needs a human decision, and which part only needs a small fix.
That’s also why attribution matters in the background. If you want to see how a signal connects to a result, here’s what marketing attribution means in practice regarding performance data. is a useful companion idea, because the metric only becomes valuable when it points to the next action.
Each of these examples has the same shape. A specific metric moved, the team found the bottleneck, and one targeted change fixed it. That’s the real value of monitoring: it shortens the distance between “something is off” and “here’s what we changed.”
Best Practices and Troubleshooting Playbook
The fastest way to make monitoring useful is to keep it disciplined. Instrument the user-facing path first, define baselines before alerts, track p95 not just averages, tie each KPI to a decision, and review dashboards weekly instead of checking every screen every hour.
A good playbook also needs a debugging order. If open rates drop, check send time and copy before you blame deliverability; also review performance metrics. If latency spikes, look at downstream dependencies before you scale up blindly. If a flow stalls at one step, inspect that step’s drop-off rate before you rebuild the whole journey.
Here’s the part many teams miss: monitoring changes behavior and key performance. The value shows up in the next decision, not in the dashboard itself. If the team sees the same alert but doesn’t change the workflow, the setup is just noise.
A few rules keep the system honest.
- Instrument the front door first: Start where users interact, then work backward into the stack.
- Document every alert owner: If nobody owns the alert, people will ignore it within a week.
- Use synthetic checks for critical paths to ensure optimal performance metrics. Test the journeys that directly affect revenue or support.
- Automate runbooks for common issues: The faster the response, the less time users spend feeling the problem.
If you want a resource for the discipline around test design and validation, running reliable performance tests is a good mental companion, because good monitoring and good benchmarking both depend on clean signals and repeatable checks.
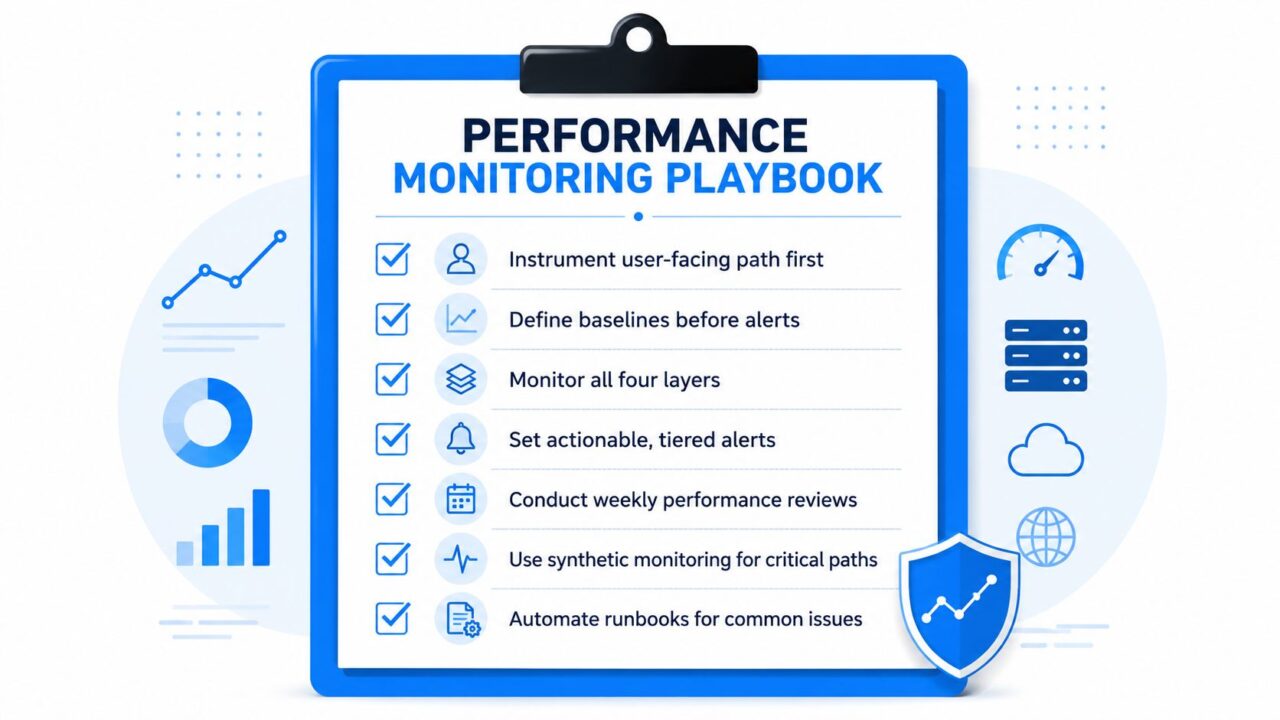
Performance Monitoring Checklist
Monitoring is a habit, not a tool.
Frequently Asked Questions About Performance Monitoring
In the next 24 hours, pick one journey, one baseline, and one alert that a real person owns. That’s enough to turn monitoring from a screen full of numbers into a working operating habit. Do this with Clepher.

Related Posts
Customer Experience Optimization Playbook
October 8, 2026Automated Checkout Bot: Build and Launch Guide
October 7, 2026AI Agent Framework: Architecture, Tools, and Use Cases
October 6, 2026
Founder Clepher